

Causes of death and infant mortality rates among full-term births in the United States between 2010 and 2012: An observational study
- PMID: 29558463
- PMCID: PMC5860700
- DOI: 10.1371/journal.pmed.1002531
Causes of death and infant mortality rates among full-term births in the United States between 2010 and 2012: An observational study
Abstract
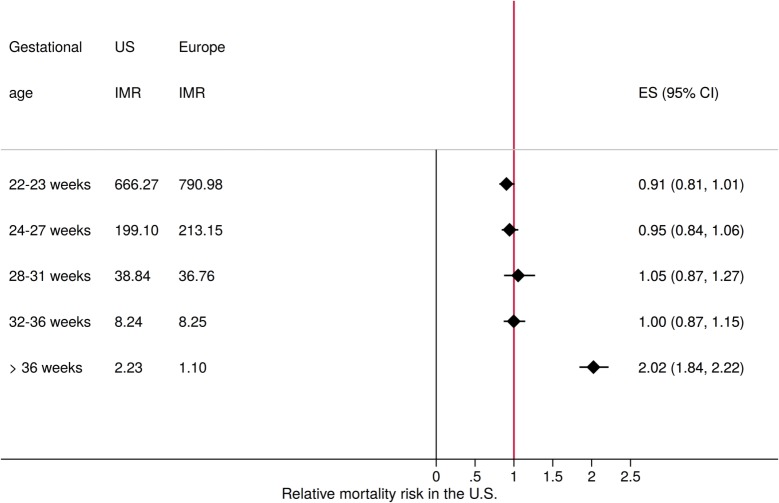
Background: While the high prevalence of preterm births and its impact on infant mortality in the US have been widely acknowledged, recent data suggest that even full-term births in the US face substantially higher mortality risks compared to European countries with low infant mortality rates. In this paper, we use the most recent birth records in the US to more closely analyze the primary causes underlying mortality rates among full-term births.
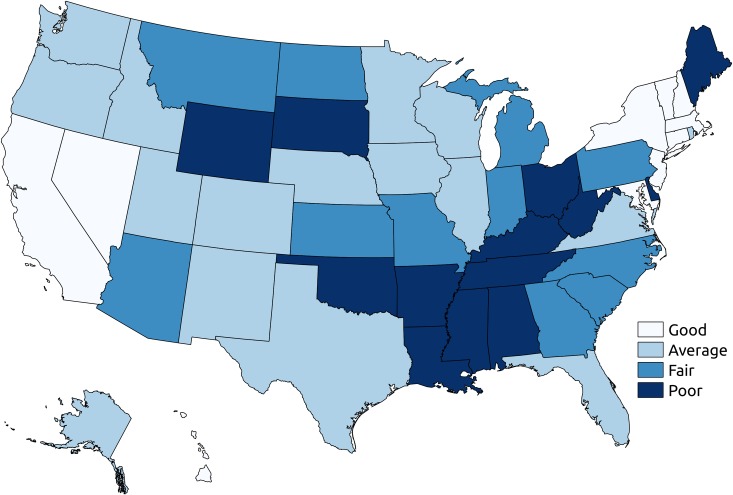
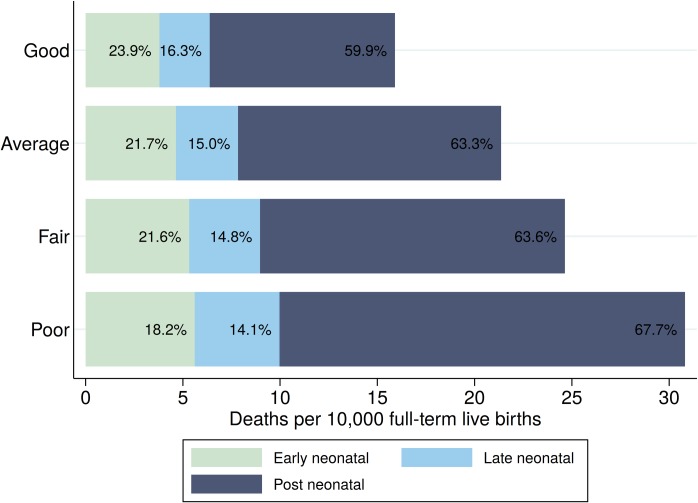
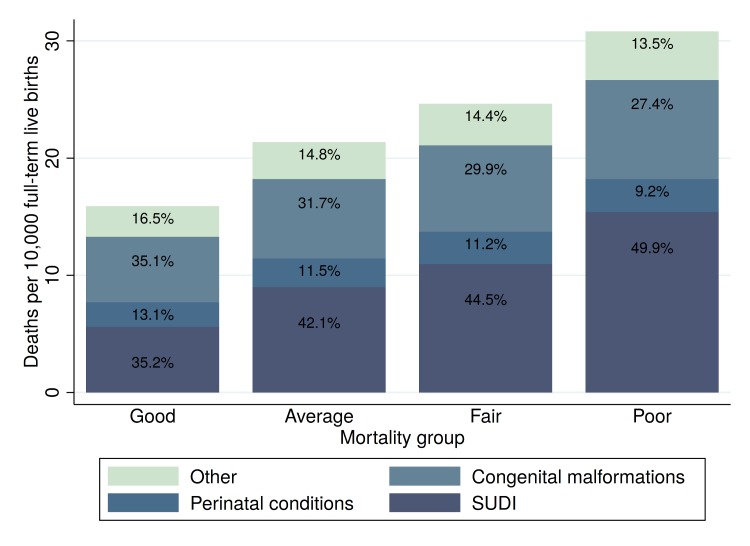
Methods and findings: Linked birth and death records for the period 2010-2012 were used to identify the state- and cause-specific burden of infant mortality among full-term infants (born at 37-42 weeks of gestation). Multivariable logistic models were used to assess the extent to which state-level differences in full-term infant mortality (FTIM) were attributable to observed differences in maternal and birth characteristics. Random effects models were used to assess the relative contribution of state-level variation to FTIM. Hypothetical mortality outcomes were computed under the assumption that all states could achieve the survival rates of the best-performing states. A total of 10,175,481 infants born full-term in the US between January 1, 2010, and December 31, 2012, were analyzed. FTIM rate (FTIMR) was 2.2 per 1,000 live births overall, and ranged between 1.29 (Connecticut, 95% CI 1.08, 1.53) and 3.77 (Mississippi, 95% CI 3.39, 4.19) at the state level. Zero states reached the rates reported in the 6 low-mortality European countries analyzed (FTIMR < 1.25), and 13 states had FTIMR > 2.75. Sudden unexpected death in infancy (SUDI) accounted for 43% of FTIM; congenital malformations and perinatal conditions accounted for 31% and 11.3% of FTIM, respectively. The largest mortality differentials between states with good and states with poor FTIMR were found for SUDI, with particularly large risk differentials for deaths due to sudden infant death syndrome (SIDS) (odds ratio [OR] 2.52, 95% CI 1.86, 3.42) and suffocation (OR 4.40, 95% CI 3.71, 5.21). Even though these mortality differences were partially explained by state-level differences in maternal education, race, and maternal health, substantial state-level variation in infant mortality remained in fully adjusted models (SIDS OR 1.45, suffocation OR 2.92). The extent to which these state differentials are due to differential antenatal care standards as well as differential access to health services could not be determined due to data limitations. Overall, our estimates suggest that infant mortality could be reduced by 4,003 deaths (95% CI 2,284, 5,587) annually if all states were to achieve the mortality levels of the best-performing state in each cause-of-death category. Key limitations of the analysis are that information on termination rates at the state level was not available, and that causes of deaths may have been coded differentially across states.
Conclusions: More than 7,000 full-term infants die in the US each year. The results presented in this paper suggest that a substantial share of these deaths may be preventable. Potential improvements seem particularly large for SUDI, where very low rates have been achieved in a few states while average mortality rates remain high in most other areas. Given the high mortality burden due to SIDS and suffocation, policy efforts to promote compliance with recommended sleeping arrangements could be an effective first step in this direction.
Conflict of interest statement
The authors have declared that no competing interests exist.
Figures
References
-
- World Bank. DataBank: world development indicators Washington (DC): World Bank; 2016. [cited 2018 Feb 19]. Available from: http://databank.worldbank.org/data/reports.aspx?source=world-development....
-
- Centers for Disease Control and Prevention. Infant mortality and low birth weight among black and white infants—United States, 1980–2000. MMWR Morb Mortal Wkly Rep. 2002;51:589–92. - PubMed
-
- Matthews TJ, MacDorman MF. Infant mortality statistics from the 2010 period linked birth/infant death data set. Natl Vital Stat Rep. 2013;62(8):1–26. - PubMed
-
- MacDorman MF, Matthews TJ, Mohangoo AD, Zeitlin J. International comparisons of infant mortality and related factors: United States and Europe, 2010. Natl Vital Stat Rep. 2014;63(5):1–6. - PubMed
-
- ACOG Committee Opinion No 579: Definition of term pregnancy. Obstet Gynecol. 2013;122(5):1139–40. doi: 10.1097/01.AOG.0000437385.88715.4a - DOI - PubMed
Publication types
MeSH terms
LinkOut - more resources
Full Text Sources
Other Literature Sources
Medical
