. 2018 Mar 20;13(3):e0194565.
doi: 10.1371/journal.pone.0194565. eCollection 2018.

Metrics of early childhood growth in recent epidemiological research: A scoping review

Affiliations

Metrics of early childhood growth in recent epidemiological research: A scoping review

Michael Leung et al. PLoS One. .

Abstract

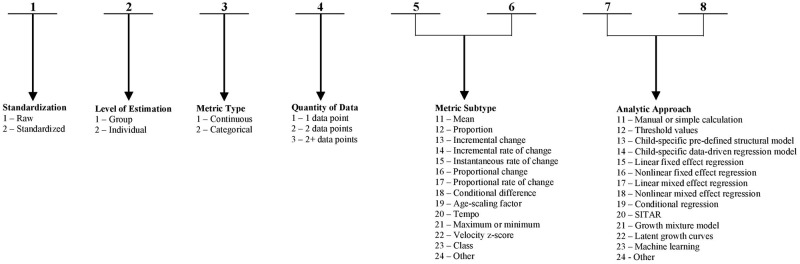
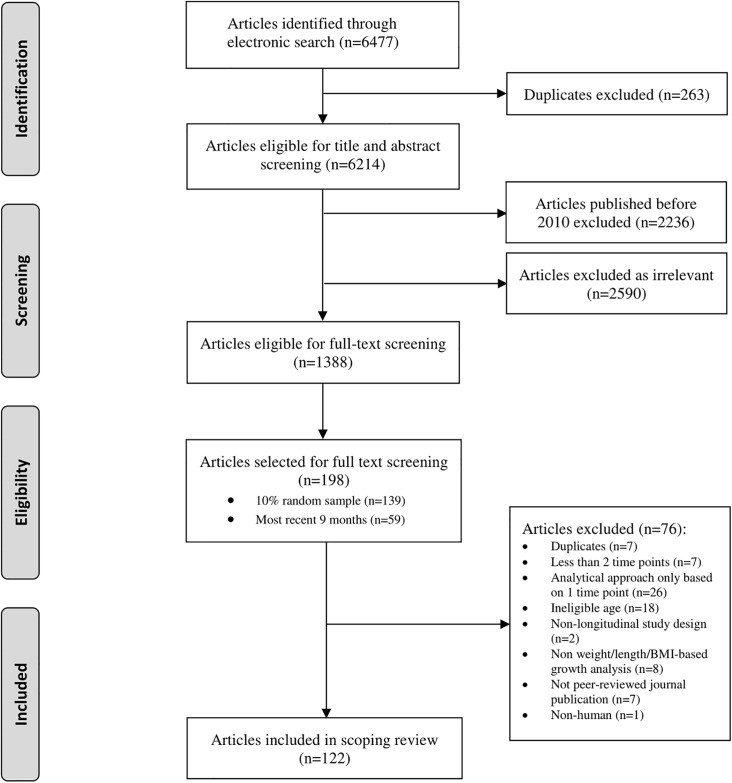
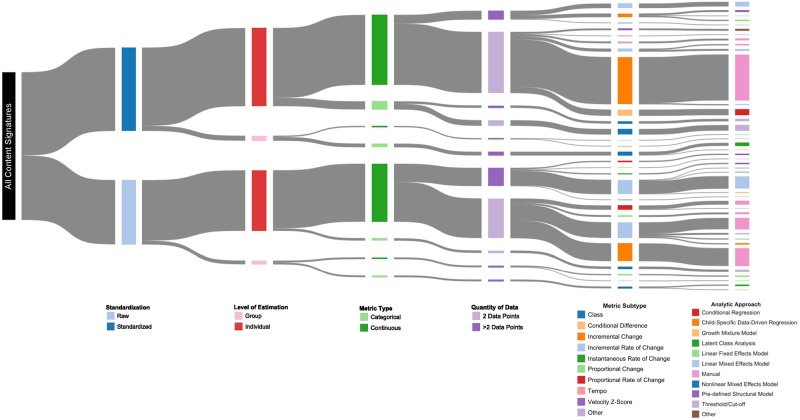
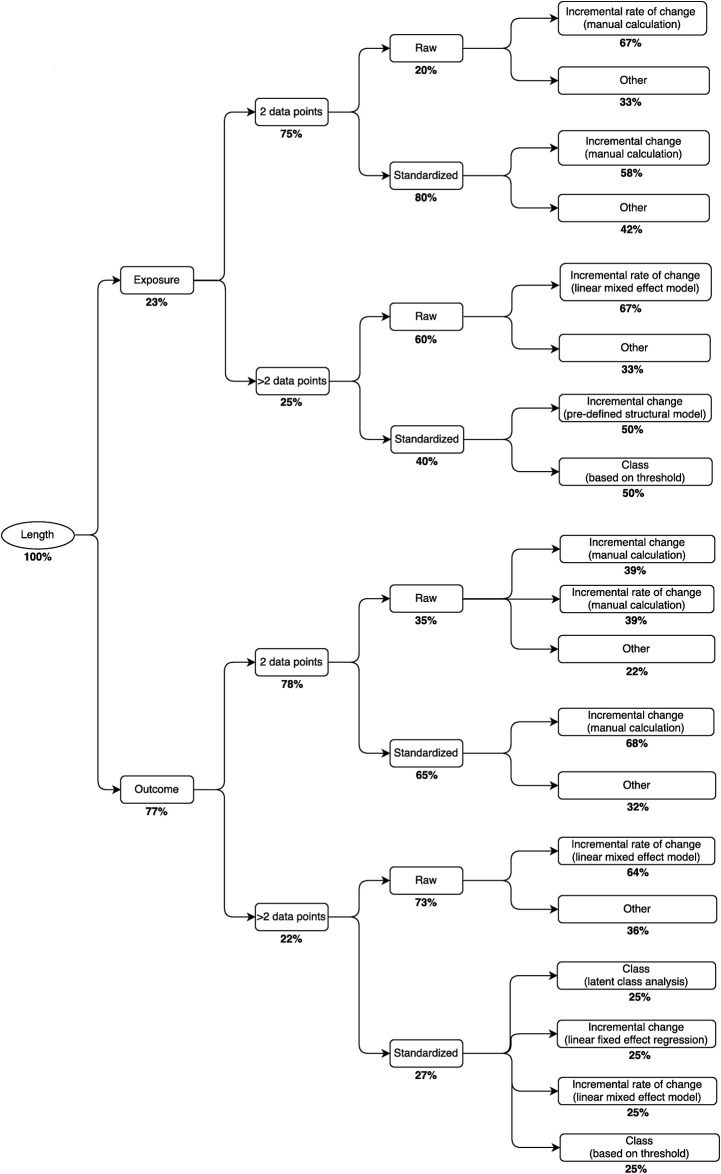
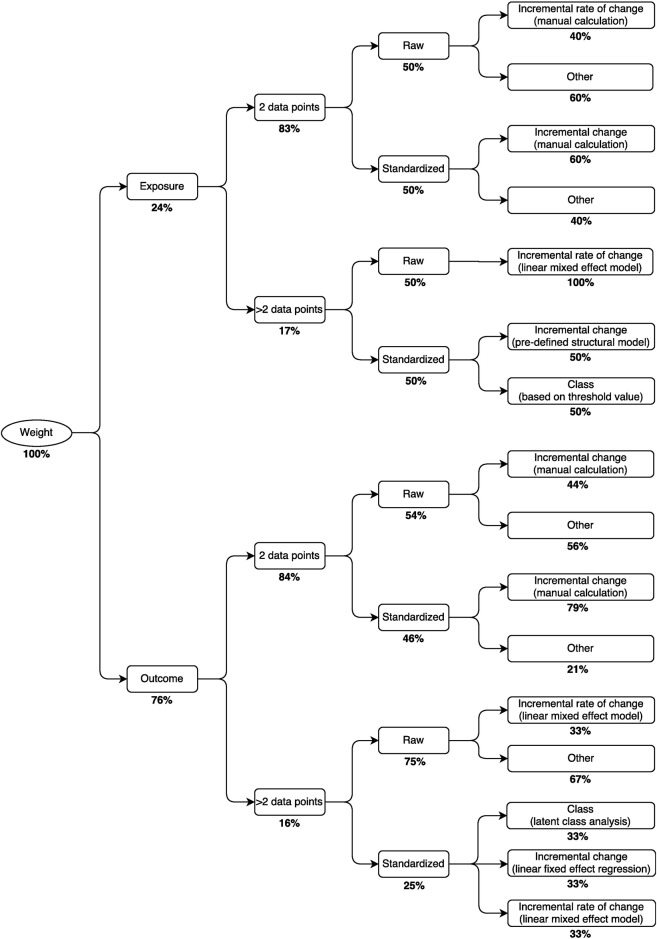
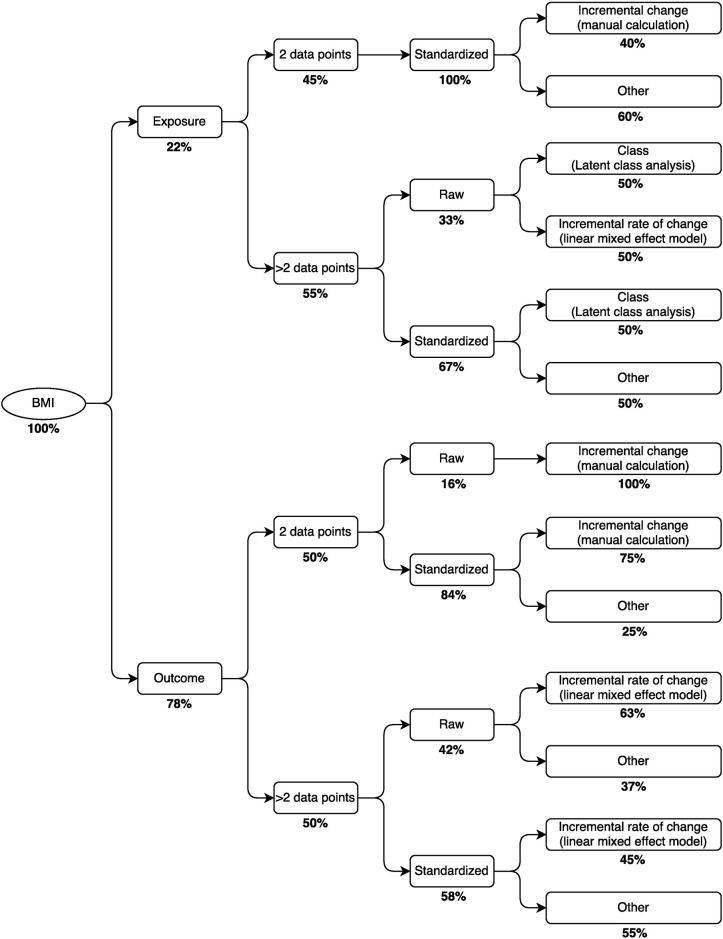
Metrics to quantify child growth vary across studies of the developmental origins of health and disease. We conducted a scoping review of child growth studies in which length/height, weight or body mass index (BMI) was measured at ≥ 2 time points. From a 10% random sample of eligible studies published between Jan 2010-Jun 2016, and all eligible studies from Oct 2015-June 2016, we classified growth metrics based on author-assigned labels (e.g., 'weight gain') and a 'content signature', a numeric code that summarized the metric's conceptual and statistical properties. Heterogeneity was assessed by the number of unique content signatures, and label-to-content concordance. In 122 studies, we found 40 unique metrics of childhood growth. The most common approach to quantifying growth in length, weight or BMI was the calculation of each child's change in z-score. Label-to-content discordance was common due to distinct content signatures carrying the same label, and because of instances in which the same content signature was assigned multiple different labels. In conclusion, the numerous distinct growth metrics and the lack of specificity in the application of metric labels challenge the integration of data and inferences from studies investigating the determinants or consequences of variations in childhood growth.


Conflict of interest statement

Competing Interests: The authors have declared that no competing interests exist.

Figures

Fig 1
Fig 1. Components and ranges of possible values of the 8-digit content signature.
Each component of the signature is represented by a 1- or 2-digit code, and the component codes were concatenated to generate the 8-digit content signature for each metric.
Fig 2
Fig 2. Flow of study selection.
Fig 3
Fig 3. A Sankey diagram to illustrate the heterogeneity among published metrics for child growth in length, weight or body mass index (n = 235) and relative prevalences overall and within each component.
Moving from left to right, content signatures are deconstructed into their individual components (i.e., standardization, level of estimation, metric type, quantity of data, metric subtype, analytic approach), where the width of the band is proportional to the frequency of the approach. The most common approach was the calculation of each child’s incremental change in the standardized anthropometric parameter, which is represented by the band that flows through the following nodes: ‘standardized parameter’ (dark blue), ‘individual level of analysis’ (dark red), ‘continuous variable’ (dark green), ‘2 data points’ (light purple), ‘incremental change’ (dark orange), and ‘manual calculation’ (pink). The range of growth metrics presented is based on a random sample of published studies, and therefore is not exhaustive.
Fig 4
Fig 4. Decision tree for selection of metrics of growth in length (n = 87).
Percentages represent the relative prevalence of the approach at each branching point. For example, the most common approach for growth in length as an exposure with 2 data points is to first standardize the anthropometric parameter, then calculate the incremental change.
Fig 5
Fig 5. Decision tree for selection of metrics of growth in weight (n = 99).
Percentages represent the relative prevalence of the approach at each branching point. For example, the most common approach for estimating growth in weight as an outcome with >2 data points was to calculate the incremental rate of change of unstandardized weight using a linear mixed effects model.
Fig 6
Fig 6. Decision tree for selection of metrics of growth in BMI (n = 49).
Percentages represent the relative prevalence of the approach at each branching point. For example, the most common approach for expressing growth in BMI as an exposure with >2 data points was to first standardize BMI, then analyze it in relation to an outcome using latent class analysis.

Similar articles

Cited by

References

    1. Victora CG, Adair L, Fall C, Hallal PC, Martorell R, Richter L, et al. Maternal and child undernutrition: consequences for adult health and human capital. Lancet (London, England). 2008. January;371(9609):340–57. - PMC - PubMed
    1. Barker DJP. The developmental origins of adult disease. J Am Coll Nutr. 2004. December;23(6 Suppl):588S–595S. - PubMed
    1. Hui LL, Schooling CM, Leung SSL, Mak KH, Ho LM, Lam TH, et al. Birth weight, infant growth, and childhood body mass index: Hong Kong’s children of 1997 birth cohort. Arch Pediatr Adolesc Med. 2008. March;162(3):212–8. doi: 10.1001/archpediatrics.2007.62 - DOI - PubMed
    1. Baird J, Fisher D, Lucas P, Kleijnen J, Roberts H, Law C. Being big or growing fast: systematic review of size and growth in infancy and later obesity. BMJ. 2005;331(7522):929–0. doi: 10.1136/bmj.38586.411273.E0 - DOI - PMC - PubMed
    1. Stettler N, Zemel BS, Kumanyika S, Stallings VA. Infant weight gain and childhood overweight status in a multicenter, cohort study. Pediatrics. 2002. February;109(2):194–9. - PubMed

Publication types