. 2018 Mar 20;319(11):1113-1124.
doi: 10.1001/jama.2018.0162.

Quality of Health Care for Children in Australia, 2012-2013

Affiliations

Quality of Health Care for Children in Australia, 2012-2013

Jeffrey Braithwaite et al. JAMA. .

Abstract

Importance: The quality of routine care for children is rarely assessed, and then usually in single settings or for single clinical conditions.

Objective: To estimate the quality of health care for children in Australia in inpatient and ambulatory health care settings.

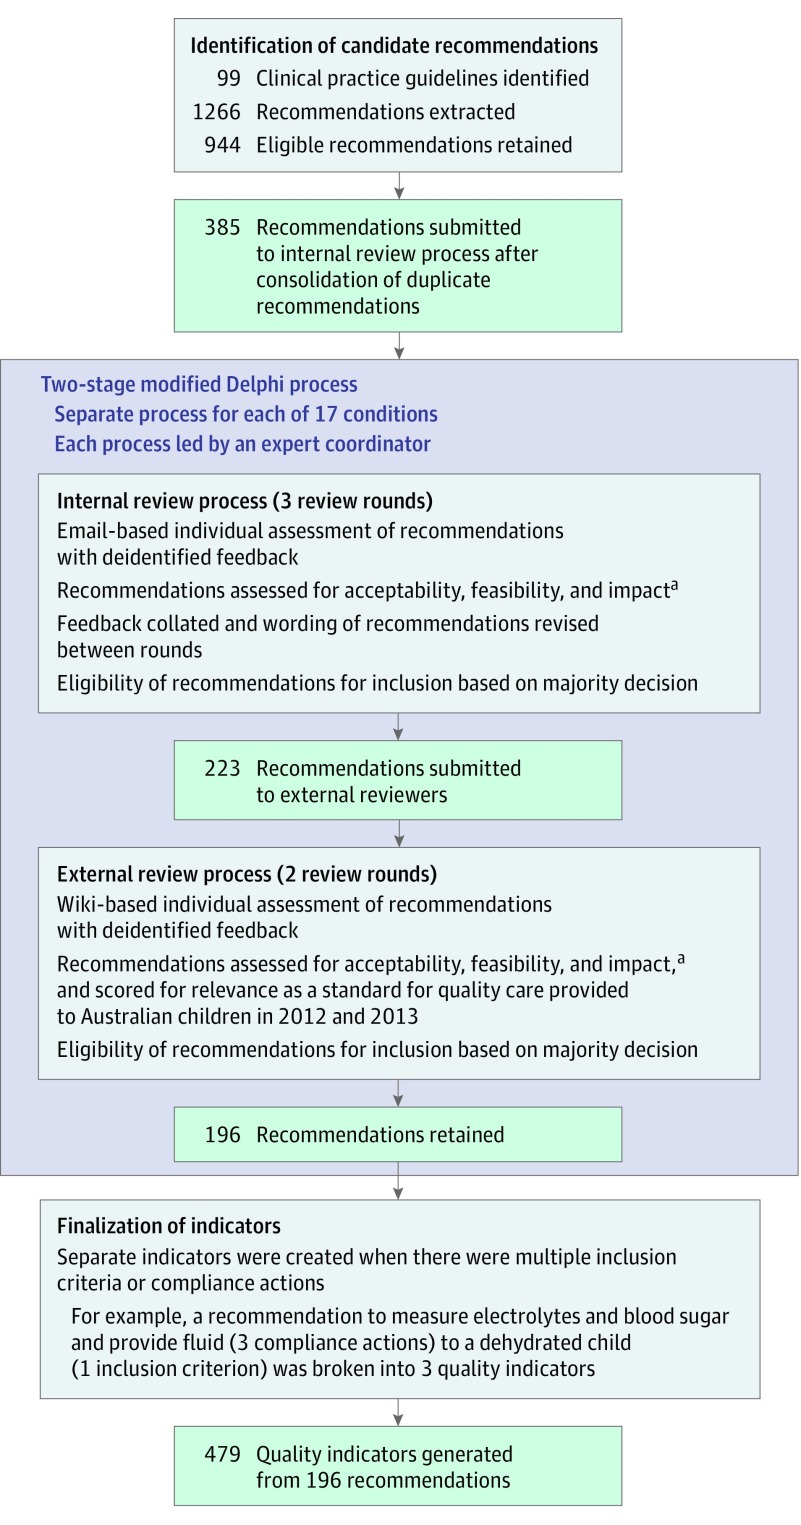
Design, setting, and participants: Multistage stratified sample with medical record review to assess adherence with quality indicators extracted from clinical practice guidelines for 17 common, high-burden clinical conditions (noncommunicable [n = 5], mental health [n = 4], acute infection [n = 7], and injury [n = 1]), such as asthma, attention-deficit/hyperactivity disorder, tonsillitis, and head injury. For these 17 conditions, 479 quality indicators were identified, with the number varying by condition, ranging from 9 for eczema to 54 for head injury. Four hundred medical records were targeted for sampling for each of 15 conditions while 267 records were targeted for anxiety and 133 for depression. Within each selected medical record, all visits for the 17 targeted conditions were identified, and separate quality assessments made for each. Care was evaluated for 6689 children 15 years of age and younger who had 15 240 visits to emergency departments, for inpatient admissions, or to pediatricians and general practitioners in selected urban and rural locations in 3 Australian states. These visits generated 160 202 quality indicator assessments.

Exposures: Quality indicators were identified through a systematic search of local and international guidelines. Individual indicators were extracted from guidelines and assessed using a 2-stage Delphi process.

Main outcomes and measures: Quality of care for each clinical condition and overall.

Results: Of 6689 children with surveyed medical records, 53.6% were aged 0 to 4 years and 55.5% were male. Adherence to quality of care indicators was estimated at 59.8% (95% CI, 57.5%-62.0%; n = 160 202) across the 17 conditions, ranging from a high of 88.8% (95% CI, 83.0%-93.1%; n = 2638) for autism to a low of 43.5% (95% CI, 36.8%-50.4%; n = 2354) for tonsillitis. The mean adherence by condition category was estimated as 60.5% (95% CI, 57.2%-63.8%; n = 41 265) for noncommunicable conditions (range, 52.8%-75.8%); 82.4% (95% CI, 79.0%-85.5%; n = 14 622) for mental health conditions (range, 71.5%-88.8%); 56.3% (95% CI, 53.2%-59.4%; n = 94 037) for acute infections (range, 43.5%-69.8%); and 78.3% (95% CI, 75.1%-81.2%; n = 10 278) for injury.

Conclusions and relevance: Among a sample of children receiving care in Australia in 2012-2013, the overall prevalence of adherence to quality of care indicators for important conditions was not high. For many of these conditions, the quality of care may be inadequate.


Conflict of interest statement

Conflict of Interest Disclosures: All authors have completed and submitted the ICMJE Form for Disclosure of Potential Conflicts of Interest. Dr Williams reported being a board director of the Australian Commission on Safety and Quality in Health Care and chair of its primary care committee. Dr C. Dalton reported being the national medical director of Bupa ANZ, which provided funding for this study through the Bupa Health Foundation, and serving on the steering committee of the Bupa Health Foundation. Ms Holt reported being the chief executive of New South Wales Kids and Families at the time it authorized its funding of this study, and authorizing funds toward the CareTrack Kids Research Study. Dr Lilford reported receiving funding from the National Institute for Health Research Collaboration for Leadership in Applied Health Research and Care, West Midlands. No other disclosures were reported.

Figures

Figure 1.
Figure 1.. Flow Diagram of Indicator Development and Ratification
aAcceptability, feasibility, and impact were assessed by reviewers scoring them as yes, no, or not applicable. Acceptability refers to the relevance of the indicator to Australian health care in 2012 and 2013; feasibility refers to the frequency of presentation and the likelihood of documentation; and impact refers to the influence of the recommended action on patient experience, safety, or effectiveness.
Figure 2.
Figure 2.. Sample Distribution
Populations aged 15 years and younger, as reported in the footnotes, are as estimated on December 31, 2012 (Australian Bureau of Statistics; Australian Demographic Statistics, series 3101). The percentage of the population that was metropolitan, as reported in the footnotes, was calculated on population estimates (aged ≤15 years) from state departments of health. Each square and circular pin identifies a health district that was sampled within the metropolitan and regional strata; pins in the regional strata are approximately at the center of the sampled health district to prevent identification of individual sites. Numbers in squares and circular pinheads are the sum of general practitioners (GPs), pediatricians, and nontertiary hospitals recruited in a health district, except for 8 pediatricians (shown with an asterisk) all recruited from metropolitan South Australia (see Figure 3, footnote g). Triangular pins mark the approximate location of tertiary pediatric hospitals, and the number in the triangles indicate the number of tertiary hospitals in that location. aQueensland: population aged ≤15 years, 976 821; percentage of population that was metropolitan, 66%; total recruited: 35 GPs, 4 pediatricians, and 12 hospitals. bSouth Australia: population aged ≤15 years, 314 511; percentage of population that was metropolitan, 68%; total recruited: 28 GPs, 8 pediatricians, and 7 hospitals. cNew South Wales: population aged ≤15 years, 1 479 680; percentage of population that was metropolitan, 70%; total recruited: 22 GPs, 8 pediatricians, and 15 hospitals.
Figure 3.
Figure 3.. Sampling Structure
Health district refers to local health district in New South Wales, hospital health service in Queensland, and local health network in South Australia. GP indicates general practitioner. aMetropolitan and regional strata are geographically defined; tertiary pediatric hospitals were sampled outside of this classification as they have statewide responsibility; and 5 of the 6 tertiary hospitals were physically located within metropolitan strata. bNumber of health districts or tertiary hospitals selected; 1 of the 6 tertiary pediatric hospitals was located within a selected health district. cNumber of sites of each type successfully recruited within the metropolitan or regional strata or among the tertiary pediatric hospitals. dFive excluded, 4 ineligible due to lack of a hospital with sufficient patient volumes, 1 excluded due to remoteness; together comprise 7.5% of regional population aged 15 years and younger. eOne excluded as ineligible due to lack of a hospital with sufficient patient volumes; 32.2% of metropolitan population aged 15 years and younger. fTwo health districts were randomly selected in regional Queensland initially. One, which contained 2 eligible hospitals, was removed because neither hospital responded to recruitment efforts; 2 other districts, each containing 1 eligible hospital, were nonrandomly selected to replace the lost district. gThe study was unable to recruit any pediatricians in the eligible health districts in South Australia; all 8 pediatricians were therefore recruited from a health district that was not eligible for selection because it lacked a hospital with the required patient volumes.

Comment in

References

    1. McGlynn EA, Asch SM, Adams J, et al. . The quality of health care delivered to adults in the United States. N Engl J Med. 2003;348(26):2635-2645. - PubMed
    1. Runciman WB, Hunt TD, Hannaford NA, et al. . CareTrack: assessing the appropriateness of health care delivery in Australia. Med J Aust. 2012;197(2):100-105. - PubMed
    1. Hathorn C, Alateeqi N, Graham C, O’Hare A. Impact of adherence to best practice guidelines on the diagnostic and assessment services for autism spectrum disorder. J Autism Dev Disord. 2014;44(8):1859-1866. - PubMed
    1. Doherty S, Jones P, Stevens H, Davis L, Ryan N, Treeve V. ‘Evidence-based implementation’ of paediatric asthma guidelines in a rural emergency department. J Paediatr Child Health. 2007;43(9):611-616. - PubMed
    1. Mangione-Smith R, DeCristofaro AH, Setodji CM, et al. . The quality of ambulatory care delivered to children in the United States. N Engl J Med. 2007;357(15):1515-1523. - PubMed

Publication types