

Global analysis of primary mesenchyme cell cis-regulatory modules by chromatin accessibility profiling
- PMID: 29558892
- PMCID: PMC5859501
- DOI: 10.1186/s12864-018-4542-z
Global analysis of primary mesenchyme cell cis-regulatory modules by chromatin accessibility profiling
Abstract
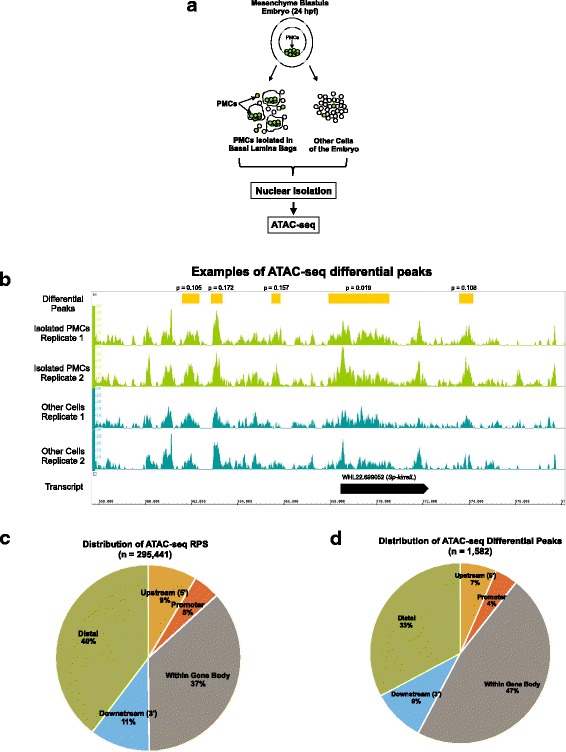
Background: The developmental gene regulatory network (GRN) that underlies skeletogenesis in sea urchins and other echinoderms is a paradigm of GRN structure, function, and evolution. This transcriptional network is deployed selectively in skeleton-forming primary mesenchyme cells (PMCs) of the early embryo. To advance our understanding of this model developmental GRN, we used genome-wide chromatin accessibility profiling to identify and characterize PMC cis-regulatory modules (CRMs).
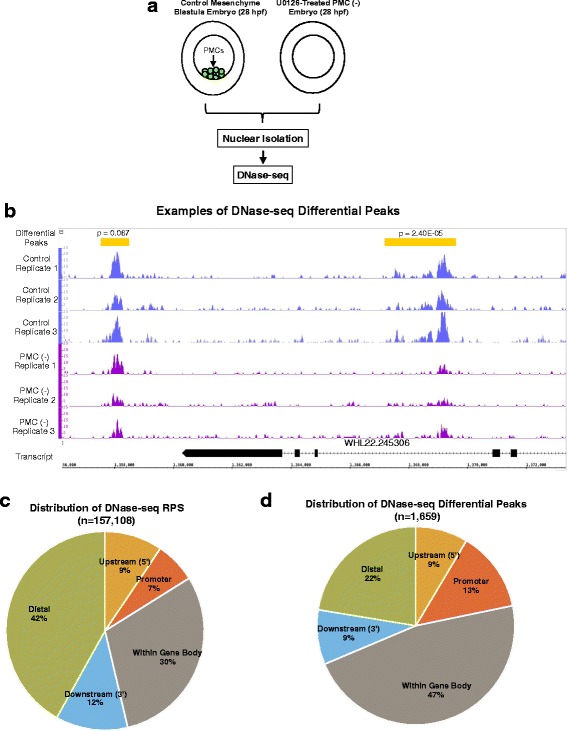
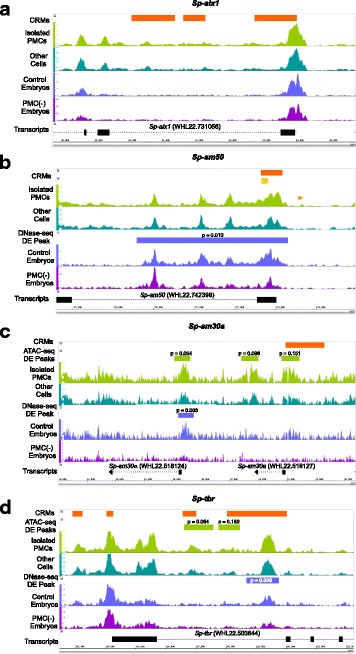
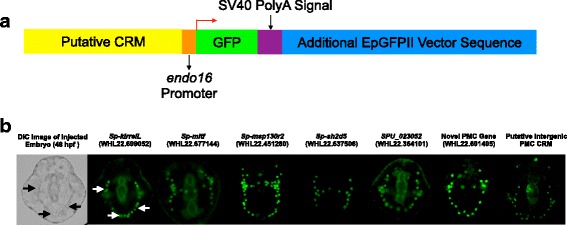
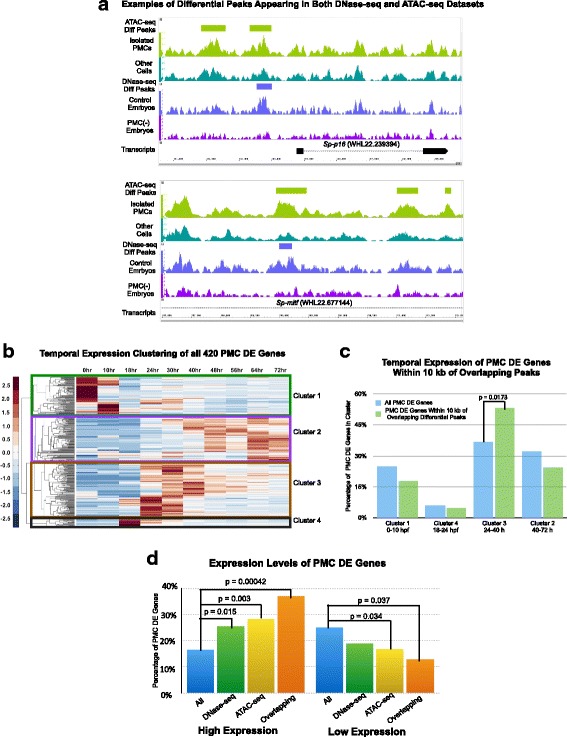
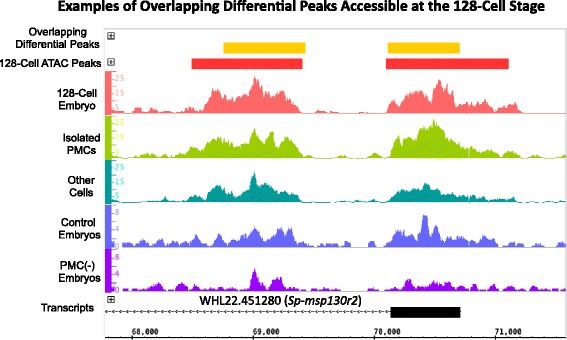
Results: ATAC-seq (Assay for Transposase-Accessible Chromatin using sequencing) analysis of purified PMCs provided a global picture of chromatin accessibility in these cells. We used both ATAC-seq and DNase-seq (DNase I hypersensitive site sequencing) to identify > 3000 sites that exhibited increased accessibility in PMCs relative to other embryonic cell lineages, and provide both computational and experimental evidence that a large fraction of these sites represent bona fide skeletogenic CRMs. Putative PMC CRMs were preferentially located near genes differentially expressed by PMCs and consensus binding sites for two key transcription factors in the PMC GRN, Alx1 and Ets1, were enriched in these CRMs. Moreover, a high proportion of candidate CRMs drove reporter gene expression specifically in PMCs in transgenic embryos. Surprisingly, we found that PMC CRMs were partially open in other embryonic lineages and exhibited hyperaccessibility as early as the 128-cell stage.
Conclusions: Our work provides a comprehensive picture of chromatin accessibility in an early embryonic cell lineage. By identifying thousands of candidate PMC CRMs, we significantly enhance the utility of the sea urchin skeletogenic network as a general model of GRN architecture and evolution. Our work also shows that differential chromatin accessibility, which has been used for the high-throughput identification of enhancers in differentiated cell types, is a powerful approach for the identification of CRMs in early embryonic cells. Lastly, we conclude that in the sea urchin embryo, CRMs that control the cell type-specific expression of effector genes are hyperaccessible several hours in advance of gene activation.
Keywords: ATAC-seq; DNase-seq; Gene regulatory network; Primary mesenchyme cells; Sea urchins; Skeletogenesis.
Conflict of interest statement
Ethics approval and consent to participate
We obtained adult sea urchins from the Kerckhoff Marine Laboratory, California Institute of Technology, Pasadena, CA USA. No special permission or additional licenses were required.
Consent for publication
Not applicable.
Competing interests
The authors declare that they have no competing interests.
Publisher’s Note
Springer Nature remains neutral with regard to jurisdictional claims in published maps and institutional affiliations.
Figures
Similar articles
-
Gene regulatory networks and developmental plasticity in the early sea urchin embryo: alternative deployment of the skeletogenic gene regulatory network.Development. 2007 Sep;134(17):3077-87. doi: 10.1242/dev.009092. Epub 2007 Aug 1. Development. 2007. PMID: 17670786
-
Architecture and evolution of the cis-regulatory system of the echinoderm kirrelL gene.Elife. 2022 Feb 25;11:e72834. doi: 10.7554/eLife.72834. Elife. 2022. PMID: 35212624 Free PMC article.
-
Signal-dependent regulation of the sea urchin skeletogenic gene regulatory network.Gene Expr Patterns. 2014 Nov;16(2):93-103. doi: 10.1016/j.gep.2014.10.002. Epub 2014 Oct 16. Gene Expr Patterns. 2014. PMID: 25460514
-
Genome-wide analysis of chromatin accessibility using ATAC-seq.Methods Cell Biol. 2019;151:219-235. doi: 10.1016/bs.mcb.2018.11.002. Epub 2018 Dec 21. Methods Cell Biol. 2019. PMID: 30948010 Free PMC article. Review.
-
From genome to anatomy: The architecture and evolution of the skeletogenic gene regulatory network of sea urchins and other echinoderms.Genesis. 2018 Oct;56(10):e23253. doi: 10.1002/dvg.23253. Genesis. 2018. PMID: 30264451 Free PMC article. Review.
Cited by
-
Culture of and experiments with sea urchin embryo primary mesenchyme cells.Methods Cell Biol. 2019;150:293-330. doi: 10.1016/bs.mcb.2019.01.002. Epub 2019 Feb 11. Methods Cell Biol. 2019. PMID: 30777181 Free PMC article. Review.
-
Ocean acidification induces distinct transcriptomic responses across life history stages of the sea urchin Heliocidaris erythrogramma.Mol Ecol. 2020 Dec;29(23):4618-4636. doi: 10.1111/mec.15664. Epub 2020 Nov 16. Mol Ecol. 2020. PMID: 33002253 Free PMC article.
-
Evolutionary Changes in the Chromatin Landscape Contribute to Reorganization of a Developmental Gene Network During Rapid Life History Evolution in Sea Urchins.Mol Biol Evol. 2022 Sep 1;39(9):msac172. doi: 10.1093/molbev/msac172. Mol Biol Evol. 2022. PMID: 35946348 Free PMC article.
-
Computational approaches to understand transcription regulation in development.Biochem Soc Trans. 2023 Feb 27;51(1):1-12. doi: 10.1042/BST20210145. Biochem Soc Trans. 2023. PMID: 36695505 Free PMC article. Review.
-
Identification and prediction of developmental enhancers in sea urchin embryos.BMC Genomics. 2021 Oct 19;22(1):751. doi: 10.1186/s12864-021-07936-0. BMC Genomics. 2021. PMID: 34666684 Free PMC article.
References
-
- Peter IS, Davidson EH. Genomic control process: development and evolution. Burlington: Academic Press; 2015.
Publication types
MeSH terms
Substances
Grants and funding
LinkOut - more resources
Full Text Sources
Other Literature Sources
Molecular Biology Databases
Miscellaneous
