. 2018 Mar 20;19(1):38.
doi: 10.1186/s13059-018-1404-6.

FusorSV: an algorithm for optimally combining data from multiple structural variation detection methods

Affiliations

FusorSV: an algorithm for optimally combining data from multiple structural variation detection methods

Timothy Becker et al. Genome Biol. .

Abstract

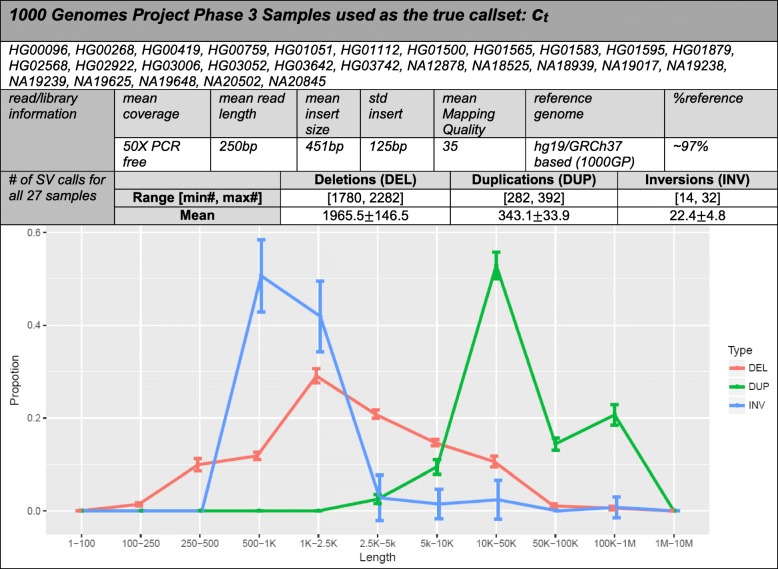
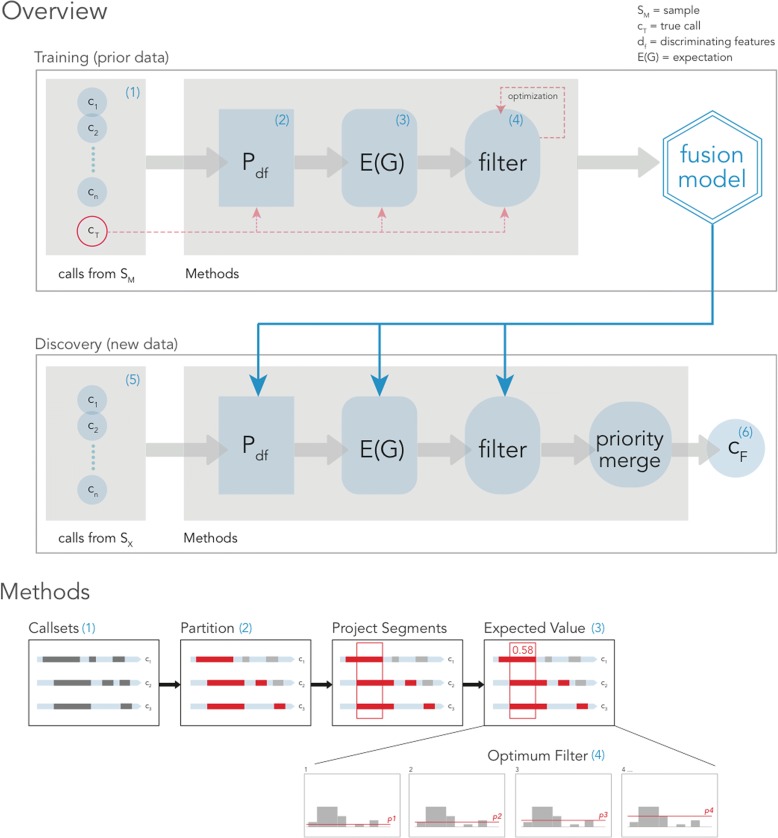
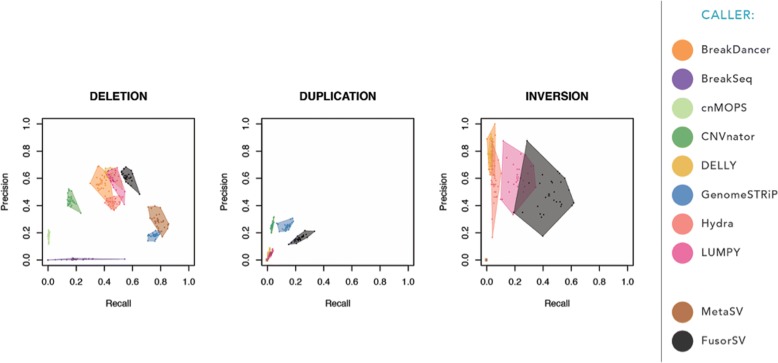
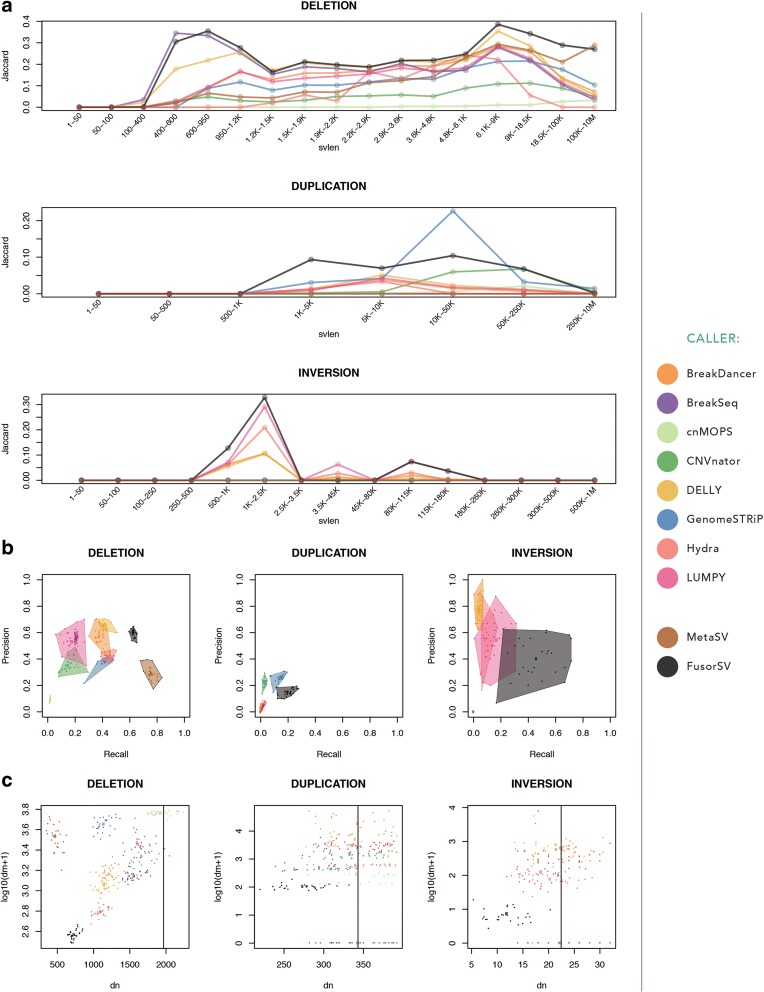
Comprehensive and accurate identification of structural variations (SVs) from next generation sequencing data remains a major challenge. We develop FusorSV, which uses a data mining approach to assess performance and merge callsets from an ensemble of SV-calling algorithms. It includes a fusion model built using analysis of 27 deep-coverage human genomes from the 1000 Genomes Project. We identify 843 novel SV calls that were not reported by the 1000 Genomes Project for these 27 samples. Experimental validation of a subset of these calls yields a validation rate of 86.7%. FusorSV is available at https://github.com/TheJacksonLaboratory/SVE .

Keywords: Copy number variation; Genome rearrangements; Next generation sequencing; Structural variation.


Conflict of interest statement

Ethics approval and consent to participate

The data from the 27 germline genomes used in this project have been consented and approved for further analysis as part of the 1000 Genomes Project.

Consent for publication

The data from the 27 germline genomes used in this project have been consented and approved for publication as part of the 1000 Genomes Project.

Competing interests

The authors declare that they have no competing interests.

Publisher’s Note

Springer Nature remains neutral with regard to jurisdictional claims in published maps and institutional affiliations.

Figures

Fig. 1
Fig. 1
1000GP 27 sample study. 27 samples were selected from the 2504 samples used in the 1000GP due to the availability of high-quality, 50X sequencing coverage comprising polymerase chain reaction-free, 250 bp Illumina PE reads (ftp://ftp.1000genomes.ebi.ac.uk/vol1/ftp/release/20130502/supporting/high_coverage_alignments/20141118_high_coverage.alignment.index). SV types represented in the VCF files were deletions, duplications, and inversions while translocations and other complex SVs were excluded. Mean mapping quality > 30 is considered good. %reference refers to what percentage of the reads mapped to the reference genome
Fig. 2
Fig. 2
FusorSV Framework (see “Methods”). (1) VCF files are first converted to an internal callset representation and then are (2) partitioned using discriminating features. (3) For every partition, a pooled pairwise distance matrix is computed from all observations and then is incorporated into the additive group expectation for every possible combination of callers with Eq. 1 in “Methods.” Partitioned callsets for each sample are projected back into a coordinate single space, where the weight of each disjoint segment is given its previously estimated expectation value by lookup. (4) A partition is fit to the data by returning the value for the proposal expectation cutoff that is the closest to the truth. (5) Given new data during discovery, filtered partitions are merged back together from smallest to largest size, discarding the lesser of overlapping calls by their expectation value and then finally clustered to yield a genotyped VCF output (6)
Fig. 3
Fig. 3
Performance evaluation of FusorSV. The results of 1000 rounds of cross-validation where 18 samples were used to train a fusion model and the remaining nine samples were tested. Being closer to the upper right corner means better performance, with the solid dot depicting the average for all samples. FusorSV improves performance by utilizing multiple algorithms while making more total calls than integrative consensus methods like MetaSV
Fig. 4
Fig. 4
FusorSV result of 27 deep-coverage samples. a The Jaccard Similarity against the truth set provides the evidence that FusorSV gets more overlaps with the truth set than any single SV-calling algorithm. b Precision-recall of all SV-calling algorithms against the truth set. Being closer to the upper right corner means better performance, with the solid dot depicting the values of a sample. FusorSV improves performance by utilizing multiple algorithms while making fewer total calls than integrative consensus methods like MetaSV. c Plot depicts number of 1000GP events per sample not called by the specific caller (dm) versus the number of called events not present in the 1000GP (dn). Being closer to the bottom left indicates higher performance. Vertical line denotes average number of calls per sample in 1000GP
Fig. 5
Fig. 5
In vitro validation techniques. a Example of PCR validation on deletion (Del_218). Lane 1 is the DNA marker; Lane 2 is the test sample; Lane 3 is the reference control; Lane 4 is the no template control (NTC). The test sample has a deletion in the target position which makes its amplification PCR size smaller than reference control. b Example of ddPCR validation on duplication (Dup_1158). NA19239 is the test sample. NA10851 and NA12878 are reference controls. NTC is the no template control. Duplicates were run to avoid random experimental error in all ddPCR experiments. NA19239 has an amplification compared to the control. This candidate has been validated. c Example of Sanger sequencing validation on Inversion (Inv_190). d Sanger sequencing chromatogram to identify inversion. The arrows indicate the breakpoints from where the sequences between test sample and control become different with each other. The yellow arrows indicated the predicted left and right breakpoints using FusorSV algorithm and the blue arrows indicated the sequenced breakpoints by Sanger sequencing. Reference: reference genomic sequences (GRCh37/hg19 Assembly) extracted from UCHC Genome Browser; Inversion_Ref: predicted inversion sequences by FusorSV; Inversion_inverted: inverted inversion sequences; Test_NA12878: nucleotide sequences from Sanger sequencing on test sample NA12878. Control_NA10851: nucleotide sequences from Sanger sequencing on control sample NA10851

References

    1. Sudmant PH, Rausch T, Gardner EJ, Handsaker RE, Abyzov A, Huddleston J, et al. An integrated map of structural variation in 2,504 human genomes. Nature. 2015;526:75–81. doi: 10.1038/nature15394. - DOI - PMC - PubMed
    1. Taberlay PC, Achinger-Kawecka J, Lun AT, Buske FA, Sabir K, Gould CM, et al. Three-dimensional disorganization of the cancer genome occurs coincident with long-range genetic and epigenetic alterations. Genome Res. 2016;26:719–731. doi: 10.1101/gr.201517.115. - DOI - PMC - PubMed
    1. Manolio TA, Collins FS, Cox NJ, Goldstein GB, Hindorff LA, Hunter DJ, et al. Finding the missing heritability of complex diseases. Nature. 2009;461:747–753. doi: 10.1038/nature08494. - DOI - PMC - PubMed
    1. Eichler EE, Flint J, Gibson G, Kong A, Leal SM, Moore JH, et al. Missing heritability and strategies for finding the underlying causes of complex disease. Nat Rev Genet. 2010;11:446–450. doi: 10.1038/nrg2809. - DOI - PMC - PubMed
    1. Zook JM, Catoe D, McDaniel J, Vang L, Spies N, Sidow A, et al. Extensive sequencing of seven human genomes to characterize benchmark reference materials. Sci Data. 2016;3:160025. doi: 10.1038/sdata.2016.25. - DOI - PMC - PubMed

Publication types