Comparative Study
. 2018 Jun 1;101(2):468-478.
doi: 10.1016/j.ijrobp.2018.01.114. Epub 2018 Feb 7.

Deep Learning Algorithm for Auto-Delineation of High-Risk Oropharyngeal Clinical Target Volumes With Built-In Dice Similarity Coefficient Parameter Optimization Function

Affiliations
Comparative Study

Deep Learning Algorithm for Auto-Delineation of High-Risk Oropharyngeal Clinical Target Volumes With Built-In Dice Similarity Coefficient Parameter Optimization Function

Carlos E Cardenas et al. Int J Radiat Oncol Biol Phys. .

Abstract

Purpose: Automating and standardizing the contouring of clinical target volumes (CTVs) can reduce interphysician variability, which is one of the largest sources of uncertainty in head and neck radiation therapy. In addition to using uniform margin expansions to auto-delineate high-risk CTVs, very little work has been performed to provide patient- and disease-specific high-risk CTVs. The aim of the present study was to develop a deep neural network for the auto-delineation of high-risk CTVs.

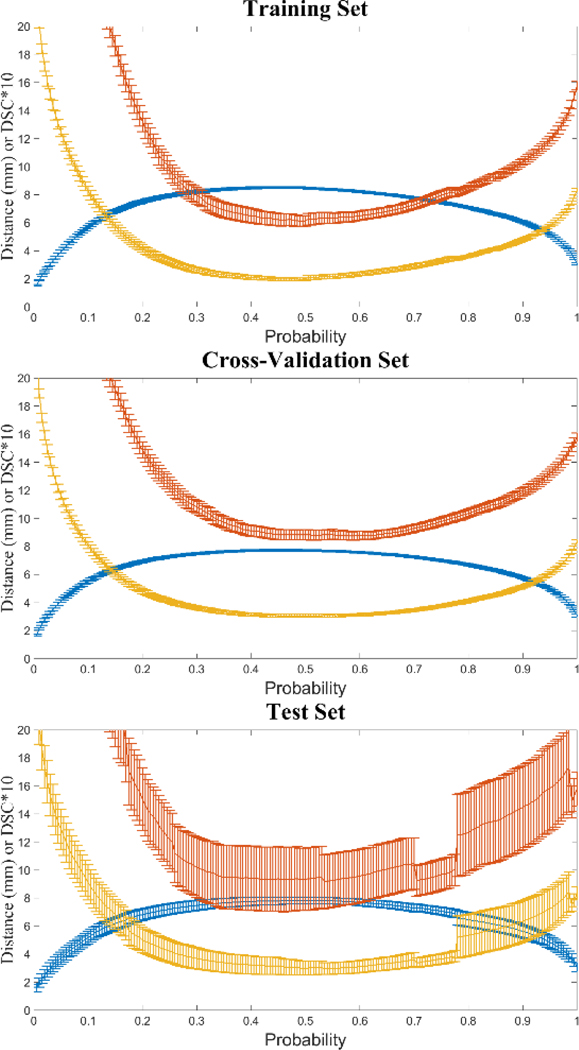
Methods and materials: Fifty-two oropharyngeal cancer patients were selected for the present study. All patients were treated at The University of Texas MD Anderson Cancer Center from January 2006 to August 2010 and had previously contoured gross tumor volumes and CTVs. We developed a deep learning algorithm using deep auto-encoders to identify physician contouring patterns at our institution. These models use distance map information from surrounding anatomic structures and the gross tumor volume as input parameters and conduct voxel-based classification to identify voxels that are part of the high-risk CTV. In addition, we developed a novel probability threshold selection function, based on the Dice similarity coefficient (DSC), to improve the generalization of the predicted volumes. The DSC-based function is implemented during an inner cross-validation loop, and probability thresholds are selected a priori during model parameter optimization. We performed a volumetric comparison between the predicted and manually contoured volumes to assess our model.

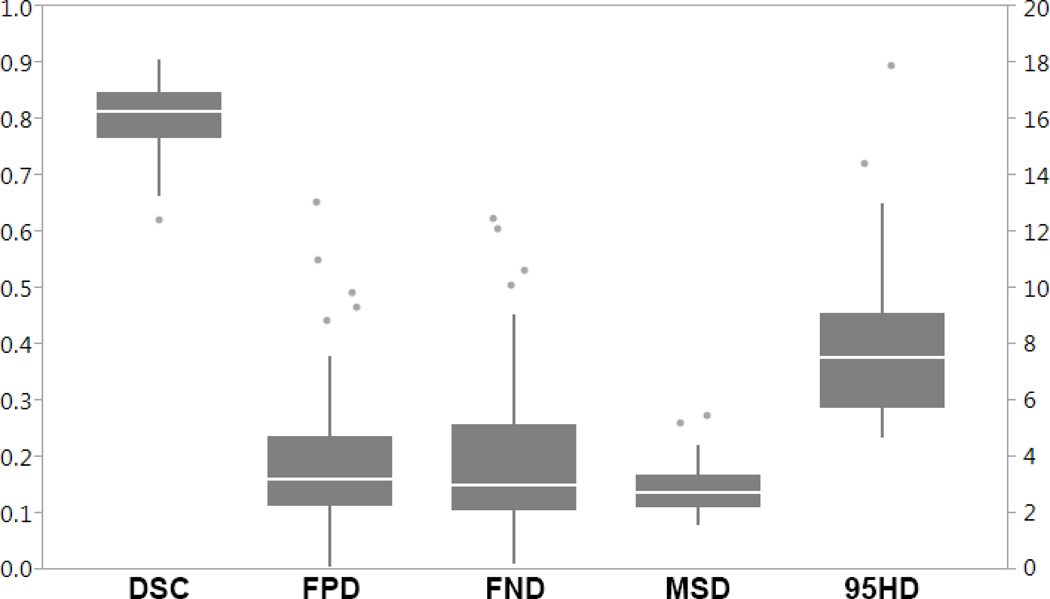
Results: The predicted volumes had a median DSC value of 0.81 (range 0.62-0.90), median mean surface distance of 2.8 mm (range 1.6-5.5), and median 95th Hausdorff distance of 7.5 mm (range 4.7-17.9) when comparing our predicted high-risk CTVs with the physician manual contours.

Conclusions: These predicted high-risk CTVs provided close agreement to the ground-truth compared with current interobserver variability. The predicted contours could be implemented clinically, with only minor or no changes.


Conflict of interest statement

Conflict of interest statement: The authors declare no conflicts of interest.

Figures

Figure 1.
Figure 1.
Block diagram of nested LOOCV. In the inner loop, model parameters are selected by maximizing the score function based on the DSC curves for all patients in the inner loop. The probability threshold value identified for the corresponding model parameters is used after training the final model to convert the predicted probability map into a binary structure on a test patient (outer loop). This final volume is then evaluated using overlap and distance metrics to compare it to the physician manually delineated high-dose CTVs.
Figure 2.
Figure 2.
Volume distributions of the gross tumor volume (GTV), ground-truth CTV (CTV1), DNN predicted CTV (CTV-DNN), and the uniform margin expansion CTV (CTV-Uni) volumes. The volume distributions of the CTV1 and CTV1-DNN volumes are similar.
Figure 3.
Figure 3.
Comparison of DSC and distance metrics for probability threshold selection. Mean DSC (plus standard error) is depicted in blue, whereas mean 95HD and MSD are in yellow and red, respectively. Note DSC is displayed as DSC×10 for visual comparison.
Figure 4.
Figure 4.
Epoch analysis results for training, cross-validation and test sets. Epochs used were 15 (blue), 50 (orange), 150 (yellow), 250 (purple), and 500 (green). Error bars provide standard error from the mean DSC value at each probability threshold.
Figure 5.
Figure 5.
Volumetric comparison between the auto-delineated and manually contoured volumes. The Dice Similarity Coefficient (DSC), False Negative Dice (FND), False Positive Dice (FPD) values are reflected by the left vertical axis, whereas the Mean Surface Distance (MSD) and 95th percentile Hausdorff distance (95HD) values are in millimeters and correspond to the right vertical axis.
Figure 6.
Figure 6.
Comparison between predicted CTV1 volumes (Blue) and physician manual contours (Red) for four oropharyngeal patients. The primary and nodal GTVs are included (Green). From left to right, we illustrate a case from each site and nodal status (base of tongue node negative, tonsil node negative, base of tongue node positive, and tonsil node positive).
Figure 7.
Figure 7.
Volumetric comparison between predicted and manual volumes per disease site and nodal status. The top panel illustrates the overlap metrics (DSC, FND, and FPD) between the four disease site and nodal status groups (BOT_N+: base of tongue node-positive, BOT_N0: base of tongue node-negative, To_N+: tonsil node-positive, To_N0: tonsil node-negative). The bottom panel provides a comparison between the four disease site and nodal status groups based on the distance metrics.

References

    1. Commission I, Radiation ON. Prescribing, Recording and Reporting Photon Beam Therapy (Supplement to ICRU Report 50). 1999.
    1. Hong TS, Tome WA, Harari PM. Heterogeneity in head and neck IMRT target design and clinical practice. Radiother Oncol. 2012;103(1):92–98. doi:10.1016/j.radonc.2012.02.010. - DOI - PMC - PubMed
    1. Eminowicz G, Mccormack M. Variability of clinical target volume delineation for definitive radiotherapy in cervix cancer. Radiother Oncol. 2015;117(3):542–547. doi:10.1016/j.radonc.2015.10.007. - DOI - PubMed
    1. Li XA, Tai A, Arthur DW, et al. Variability of target and normal structure delineation for breast- cancer radiotherapy: a RTOG multi-institutional and multi- observer study. Int J Radiat Oncol Biol Phys. 2009;73(3):944–951. doi:10.1016/j.ijrobp.2008.10.034. - DOI - PMC - PubMed
    1. Lütgendorf-caucig C, Fotina I, Stock M, Pötter R, Goldner G, Georg D. Feasibility of CBCT-based target and normal structure delineation in prostate cancer radiotherapy : Multi-observer and image multi-modality study. Radiother Oncol. 2011;98:154–161. doi:10.1016/j.radonc.2010.11.016. - DOI - PubMed

Publication types

LinkOut - more resources