

Liftoff: The Blossoming of Contraceptive Implant Use in Africa
- PMID: 29559495
- PMCID: PMC5878070
- DOI: 10.9745/GHSP-D-17-00396
Liftoff: The Blossoming of Contraceptive Implant Use in Africa
Abstract
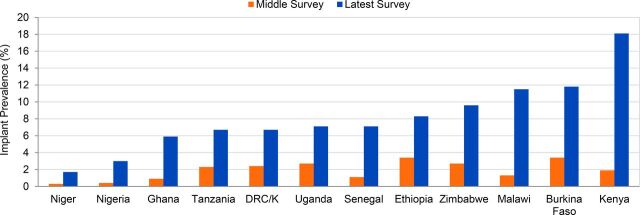
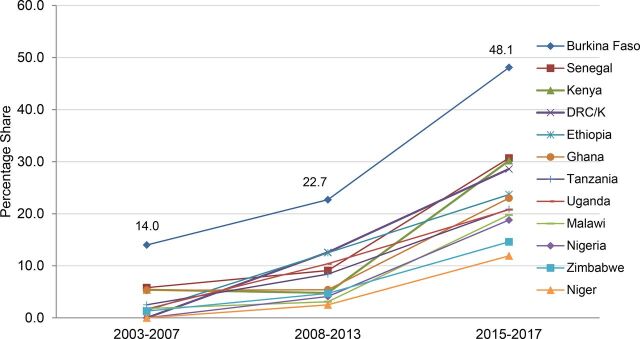
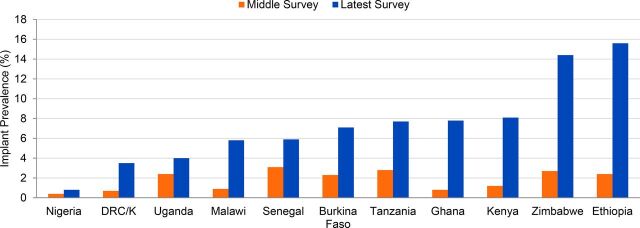
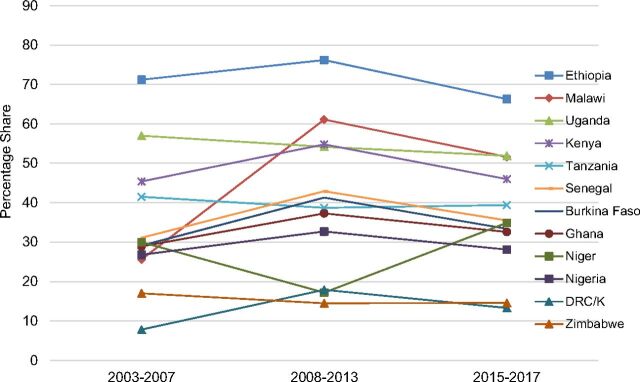
This article draws from national surveys of every sub-Saharan African country with at least 1 recent survey published between 2015 and 2017 and 2 prior surveys from 2003 to 2014. Twelve countries comprising over 60% of the region's population met these inclusion criteria. The analysis considers recent and longer-term changes in 3 key variables: modern contraceptive prevalence rate (mCPR), method-specific prevalence, and a method's share of the current modern method mix. As recently as 2011, implant CPR in sub-Saharan Africa was only 1.1%. Since then, sizeable price reductions, much-increased commodity supply, greater government commitment to rights-based family planning, broader WHO eligibility guidance, and wider adoption of high-impact service delivery practices have resulted in expanded client access and marked increases in implant prevalence and share of the method mix. Ten of the 12 countries now have an implant CPR around 6% or higher, with 3 countries above 11%. Increased implant use has been the main driver of the increased mCPR attained by 11 countries, with gains in implant use alone exceeding combined gains in use of injectables, pills, and intrauterine devices. In countries as diverse as Burkina Faso and Ethiopia, Democratic Republic of the Congo and Ghana, Kenya and Senegal, implant use now accounts for one-fourth to one-half of all modern method use. Implants have become the first or second most widely used method in 10 countries. In the 7 countries with multiple surveys conducted over a 2- to 3-year span between 2013-14 and 2016-17, average annual gains in implant prevalence range from 0.97 to 4.15 percentage points; this contrasts to historical annual gains in use of all modern methods of 0.70 percentage points in 42 sub-Saharan African countries from 1986 to 2008. Implant use has risen substantially and fairly equitably across almost all sociodemographic categories, including unmarried women, women of lower and higher parity, women in all 5 wealth quintiles, younger and older women, and women residing in rural areas. A notable exception is the category of nulliparous married women, whose implant use is mostly below 1%. These attainments represent a major success story not often seen in family planning programming. With continued program commitment and donor support, these trends in implant uptake and popularity are likely to continue for the next few years. This implies even greater need for the international family planning community to maintain its focus on rights-based programming, ensuring reliable access to implant removal as well as insertion services, and addressing issues of financing and sustainability.
© Jacobstein.
Figures
References
-
- United Nations (UN), Department of Economic and Social Affairs, Population Division. World Contraceptive Patterns 2013. New York: UN; 2013. http://www.un.org/en/development/desa/population/publications/family/con.... Accessed February 27, 2018.
-
- World Development Indicators. Washington, DC: World Bank. http://wdi.worldbank.org/table/2.1. Accessed October 20, 2017.
-
- DHS Overview. The DHS Program website. https://dhsprogram.com/What-We-Do/Survey-Types/DHS.cfm. Accessed February 27, 2018.
-
- PMA2020/Publications/Briefs/Family Planning. Performance Monitoring and Accountability 2020 (PMA2020) website. http://pma2020.org/fp-briefs. Accessed February 27, 2018.
Publication types
MeSH terms
Substances
LinkOut - more resources
Full Text Sources
Other Literature Sources
Research Materials
Miscellaneous