. 2018 Mar 20;9(2):e00342-18.
doi: 10.1128/mBio.00342-18.

Interleukin-1β Signaling in Dendritic Cells Induces Antiviral Interferon Responses

Affiliations

Interleukin-1β Signaling in Dendritic Cells Induces Antiviral Interferon Responses

Lauren D Aarreberg et al. mBio. .

Abstract

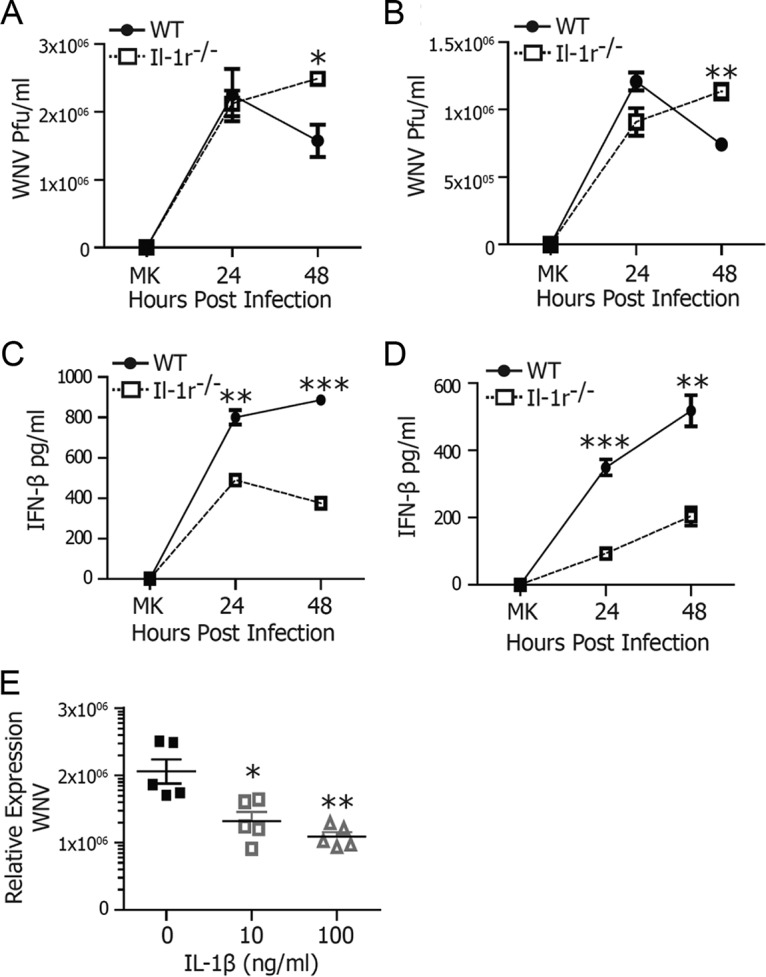
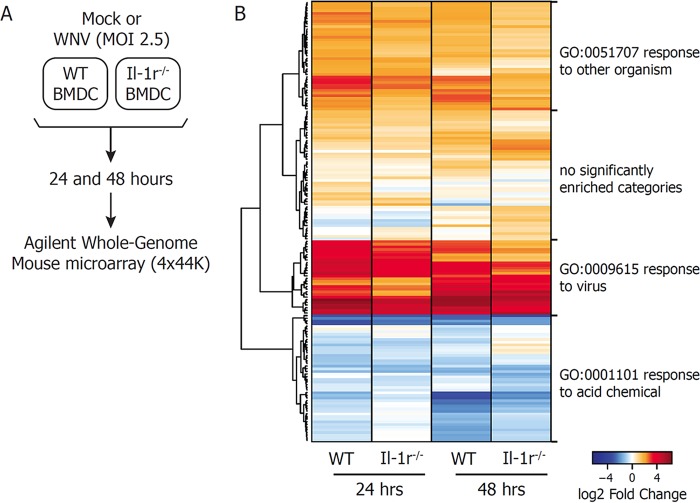
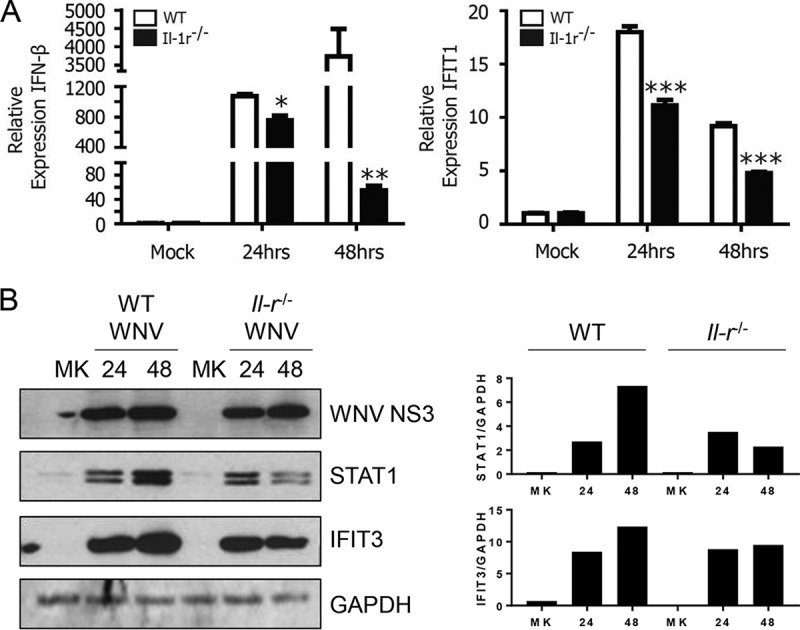
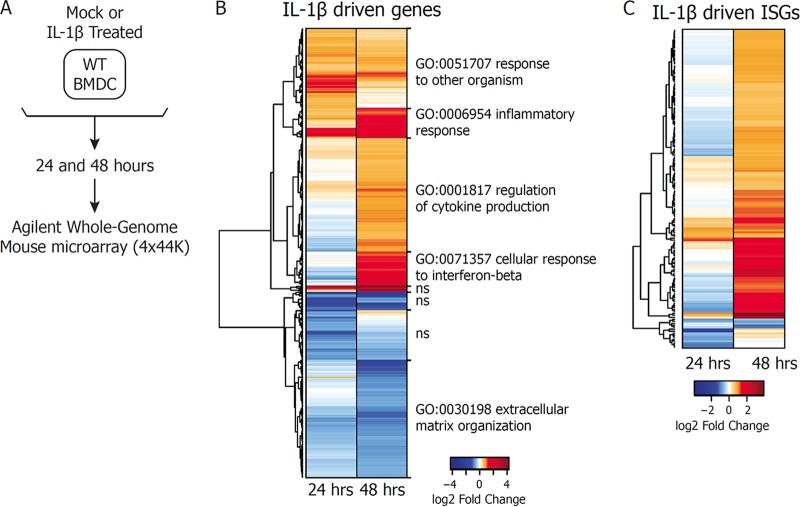
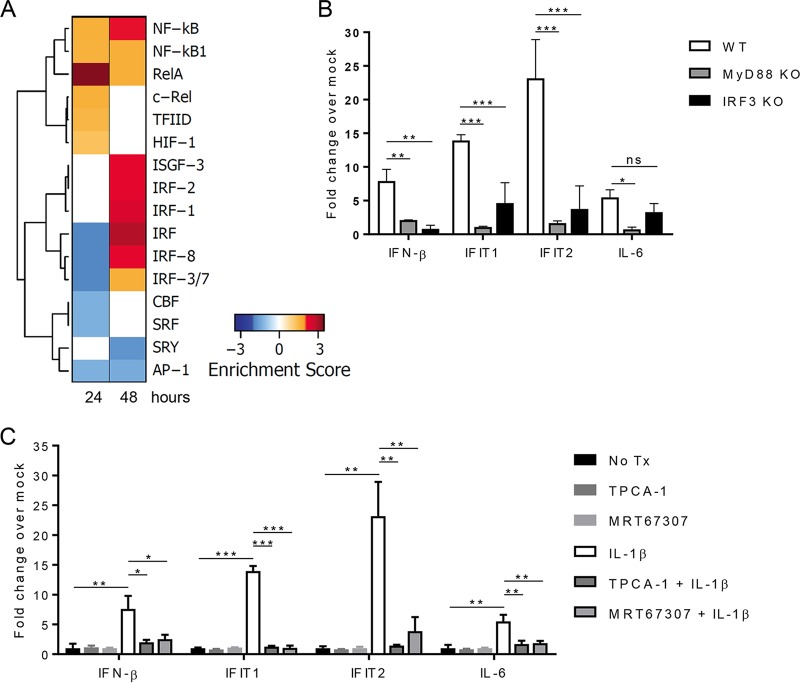
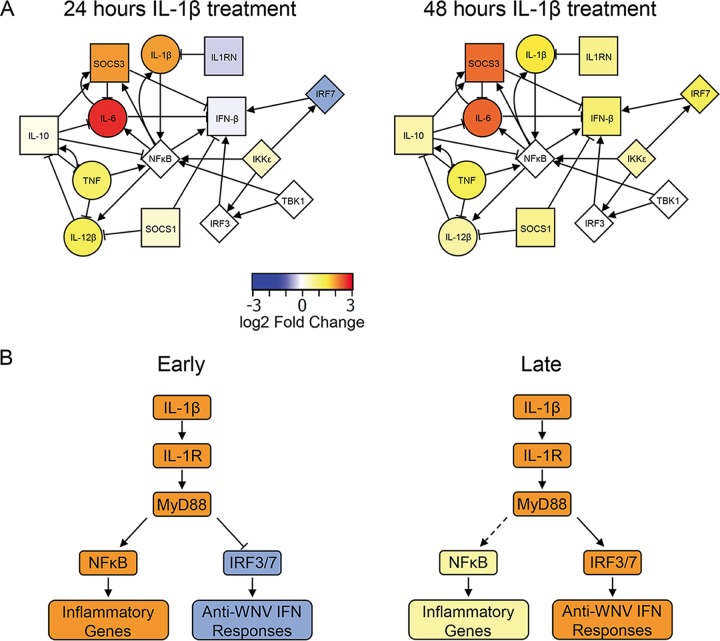
Induction of interferon beta (IFN-β), IFN-stimulated genes (ISGs), and inflammatory responses is critical for control of viral infection. We recently identified an essential linkage of stimulation of the inflammatory cytokine interleukin-1β (IL-1β) and induction of ISGs that function as host restriction pathways against the emerging flavivirus West Nile virus (WNV) in vivo Here we utilized ex vivo global transcriptome analysis of primary dendritic cells, known targets of WNV replication, to define gene signatures required for this IL-1β-driven antiviral response. Dendritic cells that were deficient in IL-1 receptor signaling showed dysregulation of cell-intrinsic defense genes and loss of viral control during WNV infection. Surprisingly, we found that in wild-type cells, IL-1β treatment, in the absence of infection, drove the transcription of IFN-β and ISGs at late times following treatment. Expression of these antiviral innate immune genes was dependent on the transcription factor IFN regulatory factor 3 (IRF3) and appears to reflect a general shift in IL-1β signaling from an early inflammatory response to a late IFN-mediated response. These data demonstrate that inflammatory and antiviral signals integrate to control viral infection in myeloid cells through a process of IL-1β-to-IRF3 signaling crosstalk. Strategies to exploit these cytokines in the activation of host defense programs should be investigated as novel therapeutic approaches against individual pathogens.IMPORTANCE West Nile virus is an emerging mosquito-borne flavivirus that can result in serious illness, neuropathology, and death in infected individuals. Currently, there are no vaccines or therapies for human use against West Nile virus. Immune control of West Nile virus infection requires inflammatory and antiviral responses, though the effect that each arm of this response has on the other is unclear. The significance of our research is in defining how virus-induced inflammatory responses regulate critical antiviral immune programs for effective control of West Nile virus infection. These data identify essential mechanisms of immune control that can inform therapeutic efforts against West Nile virus, with potential efficacy against other neuroinvasive viruses.

Keywords: IL-1; West Nile virus; flavivirus; genomics; inflammasome; innate immunity; interferon; virus.


Figures

FIG 1
FIG 1
IL-1 signaling is required for WNV control. BMDCs (A, C) or BMMs (B, D) from WT or Il-1r−/− mice were infected with WNV at an MOI of 2.5 and compared with mock-infected cells. At 24 and 48 h, WNV titers were determined by plaque assay (A, B) and IFN-β levels were measured by ELISA (C, D). (E) IL-1β (0, 10, or 100 ng/ml) was titrated onto WT BMDCs 24 h prior to infection with WNV at an MOI of 2.5. WNV RNA was measured by qRT-PCR at 48 h p.i. The data are averages of three (A to D) or five (E) independent experiments. Asterisks indicate values that are statistically significantly different by Mann-Whitney U test (A, B) or by unpaired t test (C to E) (*, P < 0.05; **, P < 0.01; ***, P < 0.001). MK, mock treatment.
FIG 2
FIG 2
Genome-wide expression analysis of IL-1R-regulated genes. (A) Schematic diagram of the microarray design used in this study. WT or Il-1r−/− BMDCs were mock infected or infected with WNV at an MOI of 2.5. Total RNA was extracted at 24 and 48 h p.i. and subjected to Agilent Whole Mouse Genome Microarray analysis. (B) Gene expression levels were determined as fold changes with respect to matched, mock-treated controls. A significant change is defined as a >1.5-fold increase or decrease with respect to mock treatment, with a BH-adjusted P value of <0.05. IL-1R-regulated genes were defined as those whose fold changes with respect to mock treatment in Il-1r−/− BMDCs were >1.5-fold decreases compared with WT cells, with a BH-adjusted P value of <0.05. WNV-induced expression of IL-1R-regulated genes was plotted on a heat map with hierarchical clustering by Euclidean distance. Gene clusters are labeled with the most significantly enriched biological process in that group.
FIG 3
FIG 3
IL-1 signaling enhances antiviral responses. (A) WT or Il-1r−/− BMDCs were mock infected or infected with WNV at an MOI of 2.5. Expression of IFN-β and IFIT1 was measured by qRT-PCR at 24 and 48 h p.i. relative to that in matched, mock-treated controls. (B) Total cell WNV NS3, STAT1, and IFIT3 protein levels were measured by immunoblotting with GAPDH as a loading control (left). Densitometry analyses of STAT1 and IFIT3 protein abundance were compared against GAPDH abundance for each condition (right). The data are the averages of three independent experiments. Asterisks indicate values that are statistically significantly different between WT and Il-1r−/− cells by unpaired t test (*, P < 0.05; **, P < 0.01; ***, P < 0.001). MK, mock treatment.
FIG 4
FIG 4
IL-1β treatment drives expression of IFN-β and ISGs. (A) Schematic diagram of the microarray design used in this study. WT BMDCs were mock treated or treated with IL-1β (100 ng/ml). Total RNA was extracted at 24 and 48 h posttreatment and subjected to Agilent Whole Mouse Genome Microarray analysis. (B) Gene expression levels were determined as fold changes with respect to matched, mock-treated controls. A significant changes is defined as a >1.5-fold increase or decrease with respect to mock treatment, with a BH-adjusted P value of <0.05. IL-1β-regulated genes were plotted on a heat map with hierarchical clustering by Euclidean distance. Gene clusters are labeled with the most significantly enriched biological process in that group. The abbreviation ns signifies no significantly enriched categories in that cluster. (C) IL-1β-driven genes were compared against genes found to be induced upon IFN-β treatment of WT BMDCs. ISGs regulated by IL-1β as defined for panel B were plotted on a heat map.
FIG 5
FIG 5
Signaling requirements of IL-1β-driven ISG responses. (A) Genes upregulated (red) or downregulated (blue) after 24 or 48 h of IL-1β treatment were assessed for enriched transcription factor binding sites (UCSC Genome Browser PWM in Enrichr [41, 74]). Significantly enriched sites are considered those with an adjusted P value of <0.05. Enrichment scores are defined as the negative log of the adjusted P value. (B) WT, Myd88−/−, and Irf3−/− BMDCs were mock treated or treated with IL-1β (100 ng/ml) for 48 h. Gene expression levels were measured by qRT-PCR and are displayed relative to those of matched, mock-treated controls. (C) WT BMDCs were mock treated (No Tx) or pretreated with the IKKβ inhibitor TPCA-1 (50 nM) or the TBK1/IKKε inhibitor MRT67307 (2 µM) for 1 h and then mock treated or treated with IL-1β (100 ng/ml) for 48 h. The data are averages of three independent experiments and represent fold changes with respect to respective mock-treated controls. Asterisks indicate values that are statistically significantly different between WT and Myd88−/− or WT and Irf3−/− cells (B) or between treatment groups and mock-treated cells (C) by unpaired t test (*, P < 0.05; **, P < 0.01; ***, P < 0.001).
FIG 6
FIG 6
Model of IL-1β-driven ISG responses. (A) Network analysis of inflammatory and anti-inflammatory genes during IL-1β treatment. Nodes represent either genes induced by IL-1β treatment or signaling molecules and transcription factors regulating their expression. Circular nodes are considered inflammatory, whereas square nodes are considered anti-inflammatory. Diamond-shaped nodes represent signaling molecules and transcription factors involved in this network. Edges between nodes were curated from the InnateDB database (71) and represent either activation (arrows) or inhibition (bars). Node fill colors represent log2-fold changes in expression following IL-1β treatment with respect to mock-treated cells at the times indicated. (B) Model of IL-1β responses in BMDCs. At early times after IL-1β exposure, signaling to NF-κB leads to upregulation of inflammation-related genes while signaling to IRF3 and IRF7 is inhibited. At later times, the inflammatory response is dampened by IRF activation, leading to induction of an anti-inflammatory response. This anti-inflammatory response includes type I IFN and other antiviral genes that promote the maintenance of antiviral responses during WNV infection.

References

    1. Dinarello CA. 2009. Immunological and inflammatory functions of the interleukin-1 family. Annu Rev Immunol 27:519–550. doi:10.1146/annurev.immunol.021908.132612. - DOI - PubMed
    1. Sen GC. 2001. Viruses and interferons. Annu Rev Microbiol 55:255–281. doi:10.1146/annurev.micro.55.1.255. - DOI - PubMed
    1. Sims JE, Smith DE. 2010. The IL-1 family: regulators of immunity. Nat Rev Immunol 10:89–102. doi:10.1038/nri2691. - DOI - PubMed
    1. Stetson DB, Medzhitov R. 2006. Type I interferons in host defense. Immunity 25:373–381. doi:10.1016/j.immuni.2006.08.007. - DOI - PubMed
    1. Mayer-Barber KD, Yan B. 2017. Clash of the cytokine titans: counter-regulation of interleukin-1 and type I interferon-mediated inflammatory responses. Cell Mol Immunol 14:22–35. doi:10.1038/cmi.2016.25. - DOI - PMC - PubMed

Publication types

MeSH terms