. 2018 Mar 20;9(2):e00358-18.
doi: 10.1128/mBio.00358-18.

Uninfected Bystander Cells Impact the Measurement of HIV-Specific Antibody-Dependent Cellular Cytotoxicity Responses

Affiliations

Uninfected Bystander Cells Impact the Measurement of HIV-Specific Antibody-Dependent Cellular Cytotoxicity Responses

Jonathan Richard et al. mBio. .

Abstract

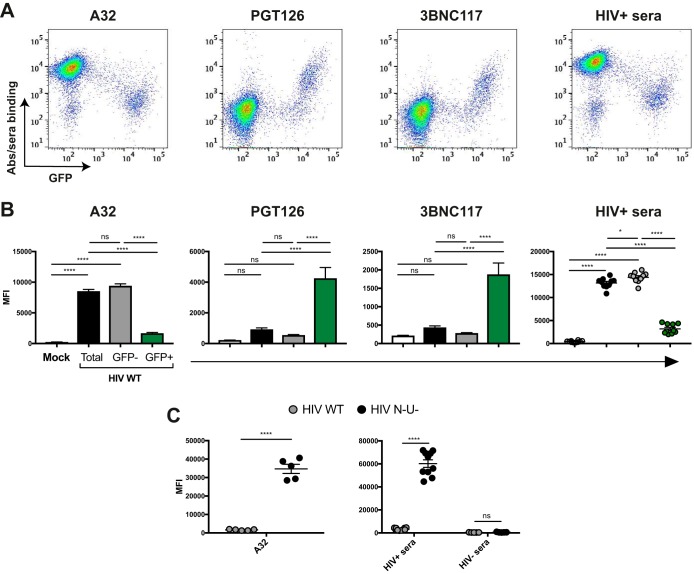
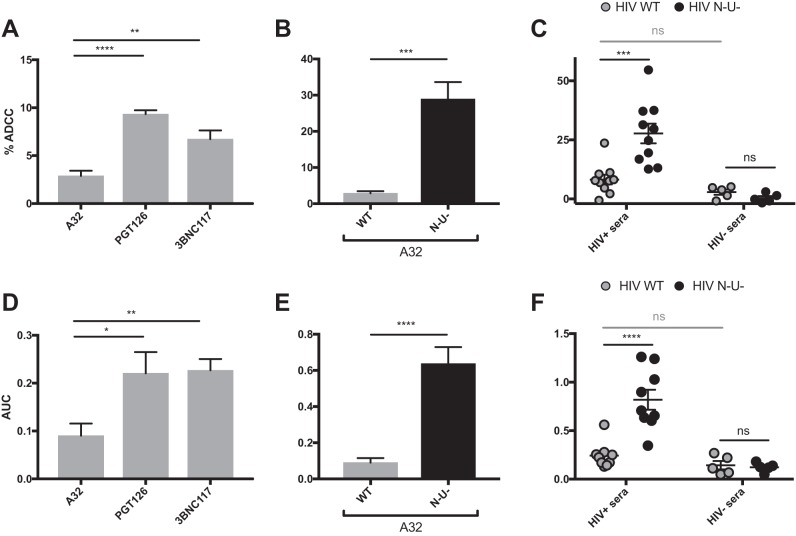
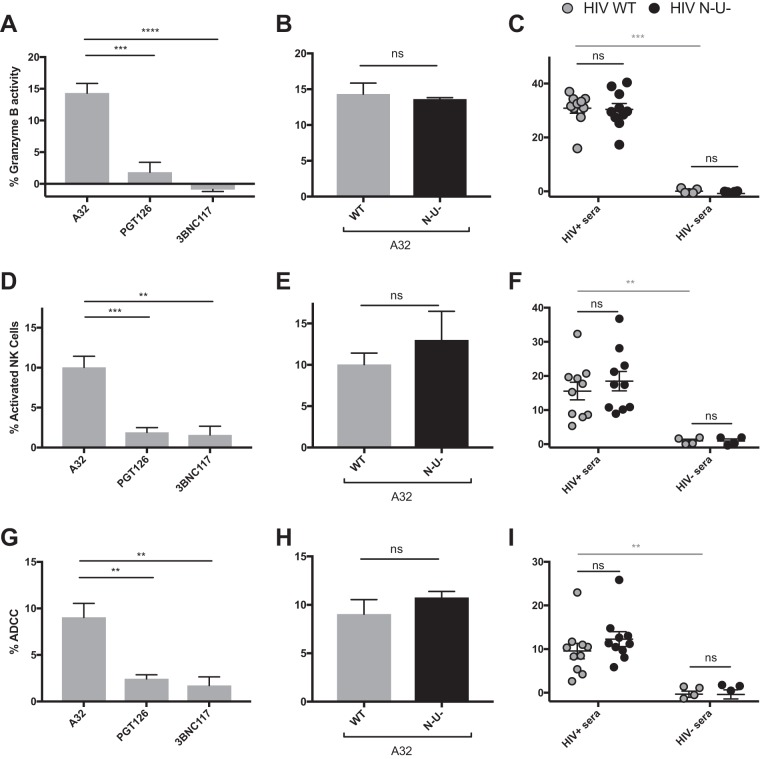
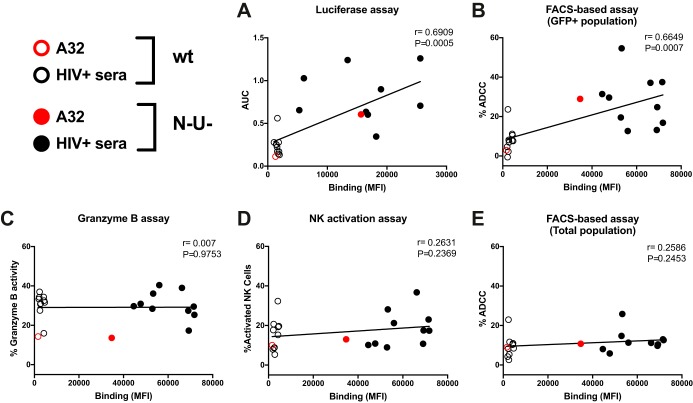
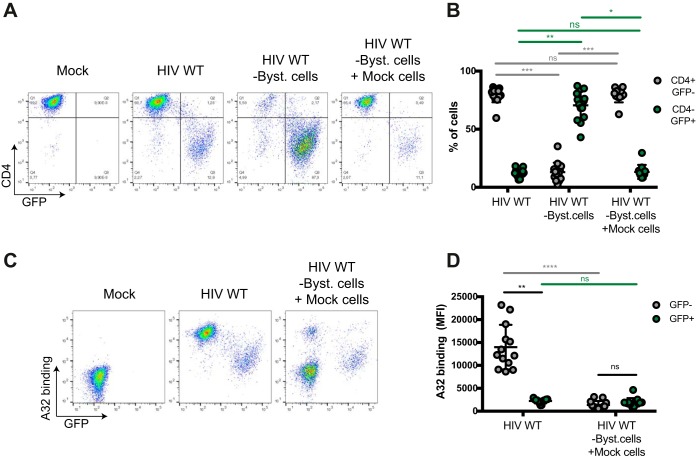
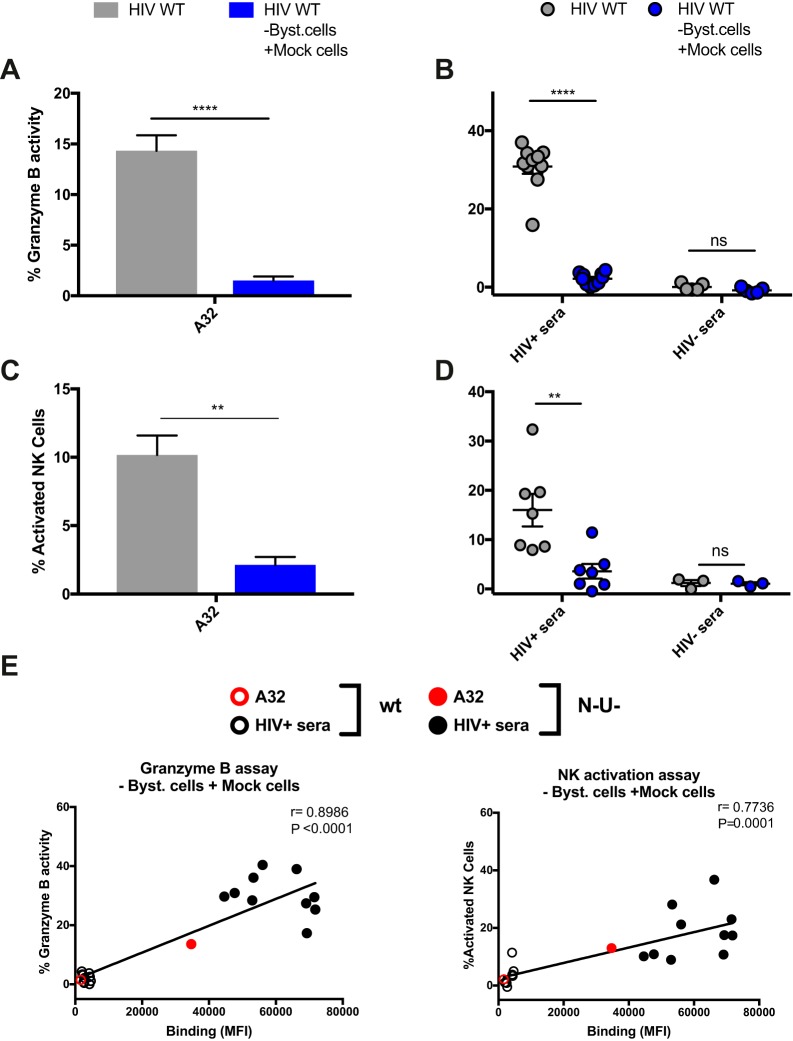
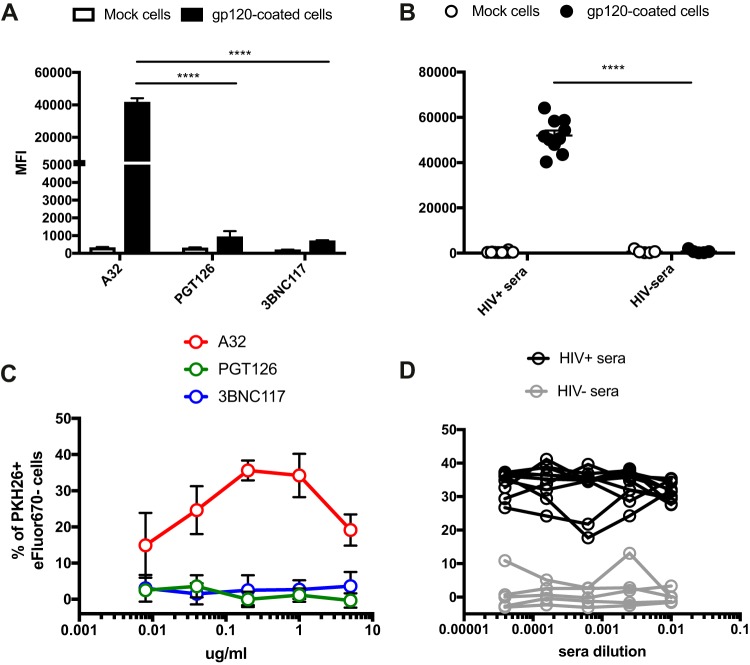
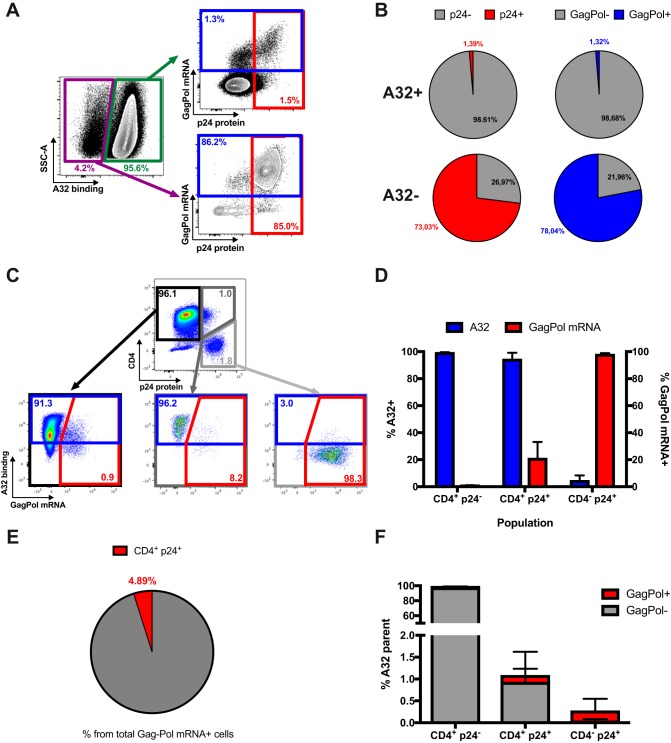
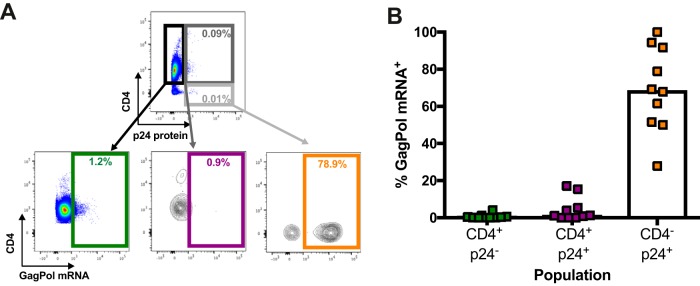
The conformation of the HIV-1 envelope glycoprotein (Env) substantially impacts antibody recognition and antibody-dependent cellular cytotoxicity (ADCC) responses. In the absence of the CD4 receptor at the cell surface, primary Envs sample a "closed" conformation that occludes CD4-induced (CD4i) epitopes. The virus controls CD4 expression through the actions of Nef and Vpu accessory proteins, thus protecting infected cells from ADCC responses. However, gp120 shed from infected cells can bind to CD4 present on uninfected bystander cells, sensitizing them to ADCC mediated by CD4i antibodies (Abs). Therefore, we hypothesized that these bystander cells could impact the interpretation of ADCC measurements. To investigate this, we evaluated the ability of antibodies to CD4i epitopes and broadly neutralizing Abs (bNAbs) to mediate ADCC measured by five ADCC assays commonly used in the field. Our results indicate that the uninfected bystander cells coated with gp120 are efficiently recognized by the CD4i ligands but not the bNabs. Consequently, the uninfected bystander cells substantially affect in vitro measurements made with ADCC assays that fail to identify responses against infected versus uninfected cells. Moreover, using an mRNA flow technique that detects productively infected cells, we found that the vast majority of HIV-1-infected cells in in vitro cultures or ex vivo samples from HIV-1-infected individuals are CD4 negative and therefore do not expose significant levels of CD4i epitopes. Altogether, our results indicate that ADCC assays unable to differentiate responses against infected versus uninfected cells overestimate responses mediated by CD4i ligands.IMPORTANCE Emerging evidence supports a role for antibody-dependent cellular cytotoxicity (ADCC) in protection against HIV-1 transmission and disease progression. However, there are conflicting reports regarding the ability of nonneutralizing antibodies targeting CD4-inducible (CD4i) Env epitopes to mediate ADCC. Here, we performed a side-by-side comparison of different methods currently being used in the field to measure ADCC responses to HIV-1. We found that assays which are unable to differentiate virus-infected from uninfected cells greatly overestimate ADCC responses mediated by antibodies to CD4i epitopes and underestimate responses mediated by broadly neutralizing antibodies (bNAbs). Our results strongly argue for the use of assays that measure ADCC against HIV-1-infected cells expressing physiologically relevant conformations of Env to evaluate correlates of protection in vaccine trials.

Keywords: A32; ADCC; ADCC assay; CD4i Abs; Env; HIV-1; RFADCC; bNAbs; granzyme B assay; luciferase assay; uninfected bystander.


Figures

FIG 1
FIG 1
Differential recognition of infected and uninfected bystander cells by ADCC-mediating Abs. Primary CD4+ T cells were mock infected or infected with the NL4.3 ADA GFP virus, either wild type (HIV WT) or defective for Nef and Vpu expression (HIV N U). Forty-eight hours postinfection, cells were stained with the anti-Env Ab (5 μg/ml) A32, PGT126, or 3BNC117 or sera (1:1,000 dilution) from 10 HIV-1-infected (HIV+ sera) or 5 uninfected (HIV sera) individuals, followed by appropriate secondary Abs. (A) Dot plots depicting representative staining of WT-infected cells. (B) Mean fluorescence intensities (MFI) obtained for at least 5 independent stainings with the different Abs and 10 HIV+ or 5 HIV sera. (C) Graphs represent the MFI obtained for 5 independent staining experiments with A32 and 10 HIV+ or 5 HIV sera on cells infected with WT and N U virus. Error bars indicate means ± standard errors of the means. Statistical significance was tested using ordinary one-way analysis of variance (B) or unpaired t test or Mann-Whitney test (C) (*, P < 0.05; ****, P < 0.0001; ns, nonsignificant).
FIG 2
FIG 2
ADCC responses detected with assays measuring the elimination of infected cells. Primary CD4+ T cells (A to C) or CEM.NKr-CCR5-sLTR-Luc cells (D to F) infected with the NL4.3 ADA GFP virus, either wild-type (HIV WT) (depicted in gray) or defective for Nef and Vpu expression (HIV N U) (depicted in black) were used as target cells with the FACS-based infected-cell elimination assay (A to C) or the luciferase assays (D to F). (A and D) ADCC responses detected with the anti-Env Abs A32, PGT126, and 3BNC117 against cells infected with the WT virus. (B, C, E, and F) ADCC responses detected with A32 (B and E) or HIV+ and HIV sera (C and F) against cells infected with WT or N U viruses. All graphs shown represent ADCC responses obtained from at least 5 independent experiments. For the FACS-based assay, MAbs were used at 5 μg/ml and human sera were used at a 1:1,000 dilution. For the luciferase assay, area under the curve (AUC) values were calculated using increased concentrations of MAbs (0.0024, 0.0098, 0.0390, 0.1563, 0.6250, 2.5, and 10 μg/ml) and increased dilutions of human sera (1:100, 1:400, 1:1,600, 1:6,400, 1:25,600, and 1:102,400). Error bars indicate means ± standard errors of the means. Statistical significance was tested using unpaired t test or Mann-Whitney test (*, P < 0.05; **, P < 0.01; ***, P < 0.001; ****, P < 0.0001; ns, nonsignificant).
FIG 3
FIG 3
ADCC responses detected with assays relying on the total cell population. Primary CD4+ T cells infected with the NL4.3 ADA GFP virus, either wild-type (HIV WT) (depicted in gray) or defective for Nef and Vpu expression (HIV N U) (depicted in black), were used as target cells in the granzyme B assay (A to C), the NK cell activation assay (D to F), or FACS-based assays (gating on the total cell population) (G to I). (A, D, and G) ADCC responses detected with the anti-Env MAbs (5 μg/ml) A32, PGT126, and 3BNC117 against cells infected with WT virus. (B, C, E, F, H, and I) ADCC responses mediated by A32 (B, E, and H) or HIV+ and HIV sera (1:1,000 dilution) (C, F, and I) against cells infected with WT or N U virus. All graphs shown represent ADCC responses obtained for at least 5 independent experiments. Error bars indicate means ± standard errors of the means. Statistical significance was tested using unpaired t test or Mann-Whitney test (*, P < 0.05; **, P < 0.01; ***, P < 0.001; ****, P < 0.0001; ns, nonsignificant).
FIG 4
FIG 4
Recognition of infected cells correlates with ADCC responses when using assays measuring the elimination of the infected-cell population. Correlation between the ability of A32 and HIV+ sera to recognize cells infected with NL4.3 ADA GFP, either wild-type (WT) or defective for Nef and Vpu expression (N U), and the ADCC responses detected against these cells using the luciferase assays (A), the FACS-based assay (on the GFP+ cell population) (B), the granzyme B assay (C), the NK cell activation assay (D), or the FACS-based assay (E) (on the total cell population) was calculated using a Pearson correlation test.
FIG 5
FIG 5
Replacement of uninfected bystander cells by autologous mock-infected cells reduces the proportion of cells recognized by A32. Primary CD4+ T cells were mock infected (Mock) or infected with the NL4.3 ADA GFP WT virus (HIV WT). Forty-eight hours postinfection, uninfected bystander CD4+ cells were removed (HIV WT -Byst. cells) and replaced by the same number of autologous mock-infected cells (HIV WT -Byst. cells + Mock cells). Cells were stained with anti-CD4 (1 μg/ml) and A32 (5 μg/ml) Abs. (A and C) Representative staining for CD4 (A) and A32 (C). (B) Percentage of CD4+ GFP and CD4 GFP+ cells. (D) MFI obtained for the A32 staining for at least 13 independent experiments. Error bars indicate means ± standard errors of the means. Statistical significance was tested using a Kruskal-Wallis test (*, P < 0.05; **, P < 0.01; ***, P < 0.001; ****, P < 0.0001; ns, nonsignificant).
FIG 6
FIG 6
Replacement of uninfected bystander cells by autologous mock-infected cells strongly reduces the ADCC responses detected with granzyme B and NK cell activation assays. Primary CD4+ T cells were mock infected (Mock) or infected with the NL4.3 ADA GFP WT virus (HIV WT). Forty-eight hours postinfection, uninfected bystander CD4+ T cells were removed and replaced by the same number of autologous mock-infected cells (HIV WT -Byst. cells +Mock cells) prior to ADCC measurements with the granzyme B assay (A and B) and the NK cell activation assay (C and D). (A and C) ADCC responses detected with A32 (5 μg/ml). (B and D) Responses mediated by HIV+ and HIV sera (1:1,000 dilution). (E) A correlation between the ability of A32 and HIV+ sera to recognize infected cells and the ADCC responses detected with the granzyme B and NK cell activation assay was observed when the uninfected bystander CD4+ T cells were replaced by autologous mock-infected cells in the context of a WT infection. All graphs shown represent ADCC responses obtained in at least 5 independent experiments. Error bars indicate means ± standard errors of the means. Statistical significance was tested using unpaired t test or Mann-Whitney test (A to D) and a Pearson correlation test (E) (**, P < 0.01; ****, P < 0.0001; ns, nonsignificant).
FIG 7
FIG 7
Measurement of ADCC responses against gp120-coated target cells. (A and B) Recognition of gp120-coated CEM.NKr cells by A32, PGT126, or 3BNC117 (A) and HIV+ or HIV sera (B). (C and D) ADCC responses detected using the RFADCC assay against gp120-coated cells with the anti-Env Ab A32, PGT126, or 3BNC117 (0.008, 0.04, 0.2, 1, and 5 μg/ml) (C) and HIV+ or HIV sera (1:100, 1:400, 1:1,600, 1:6,400, and 1:25,600 dilutions) (D). All graphs shown represent staining and ADCC responses obtained in at least 3 independent experiments. Error bars indicate means ± standard errors of the means. Statistical significance was tested using unpaired t test (****, P < 0.0001).
FIG 8
FIG 8
A32 preferentially binds to cells that are CD4+ p24 gag-pol mRNA. (A and B) Primary CD4+ T cells infected with NL3.4 ADA GFP WT virus were stained with A32, followed by appropriate secondary Abs. Cells were then stained for phenotypic markers (see Materials and Methods) prior to detection of HIV-1 p24 and gag-pol mRNA by RNA-flow FISH. (A) Example of flow cytometry gating strategy based on A32 binding. (B) Quantification of the percentage of cells positive for HIV-1 p24 or gag-pol mRNA based on A32 binding. (C) Example of flow cytometry gating based on p24 and CD4 expression. (D) Quantification of the percentage of cells positive for A32 binding and gag-pol mRNA based on CD4 and p24 levels. (E) Quantification of the percentage of p24+ CD4+ cells among the cells positive for gag-pol mRNA. (F) Quantification of the percentage of cells that are CD4+ p24, CD4+ p24+, or CD4 p24+ among the cells recognized by A32. Error bars indicate means ± standard errors of the means of at least 4 independent experiments.
FIG 9
FIG 9
The CD4+ p24+ cell population represents a minimal fraction of the gag-pol mRNA+ cells in HIV-1-infected individuals. CD4+ T cells isolated from chronically HIV-infected, untreated individuals were rested overnight. Cells were then stained for phenotypic markers (see Materials and Methods) prior to detection of HIV-1 p24 and gag-pol mRNA by RNA-flow FISH. (A) Example of flow cytometry gating based on p24 and CD4 expression. (B) Quantification of the percentage of cells positive for gag-pol mRNA based on CD4 and p24 levels. Error bars indicate means ± standard errors of the means of data obtained with 10 HIV-1-infected individuals.

Similar articles

Cited by

References

    1. Checkley MA, Luttge BG, Freed EO. 2011. HIV-1 envelope glycoprotein biosynthesis, trafficking, and incorporation. J Mol Biol 410:582–608. doi:10.1016/j.jmb.2011.04.042. - DOI - PMC - PubMed
    1. Richard J, Prévost J, Alsahafi N, Ding S, Finzi A. 2017. Impact of HIV-1 envelope conformation on ADCC responses. Trends Microbiol doi:10.1016/j.tim.2017.10.007. - DOI - PubMed
    1. Veillette M, Richard J, Pazgier M, Lewis GK, Parsons MS, Finzi A. 2016. Role of HIV-1 envelope glycoproteins conformation and accessory proteins on ADCC responses. Curr HIV Res 14:9–23. doi:10.2174/1570162X13666150827093449. - DOI - PubMed
    1. Munro JB, Gorman J, Ma X, Zhou Z, Arthos J, Burton DR, Koff WC, Courter JR, Smith AB III, Kwong PD, Blanchard SC, Mothes W. 2014. Conformational dynamics of single HIV-1 envelope trimers on the surface of native virions. Science 346:759–763. doi:10.1126/science.1254426. - DOI - PMC - PubMed
    1. Veillette M, Coutu M, Richard J, Batraville LA, Dagher O, Bernard N, Tremblay C, Kaufmann DE, Roger M, Finzi A. 2015. The HIV-1 gp120 CD4-bound conformation is preferentially targeted by antibody-dependent cellular cytotoxicity-mediating antibodies in sera from HIV-1-infected individuals. J Virol 89:545–551. doi:10.1128/JVI.02868-14. - DOI - PMC - PubMed

Publication types

MeSH terms