. 2018 May;177(1):38-51.
doi: 10.1104/pp.18.00027. Epub 2018 Mar 20.

Chloroplast Ca2+ Fluxes into and across Thylakoids Revealed by Thylakoid-Targeted Aequorin Probes

Affiliations

Chloroplast Ca2+ Fluxes into and across Thylakoids Revealed by Thylakoid-Targeted Aequorin Probes

Simone Sello et al. Plant Physiol. 2018 May.

Abstract

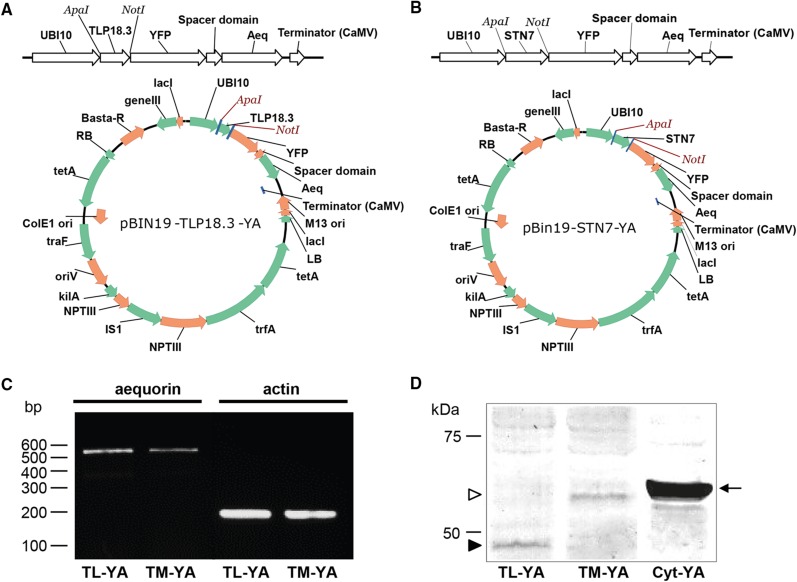
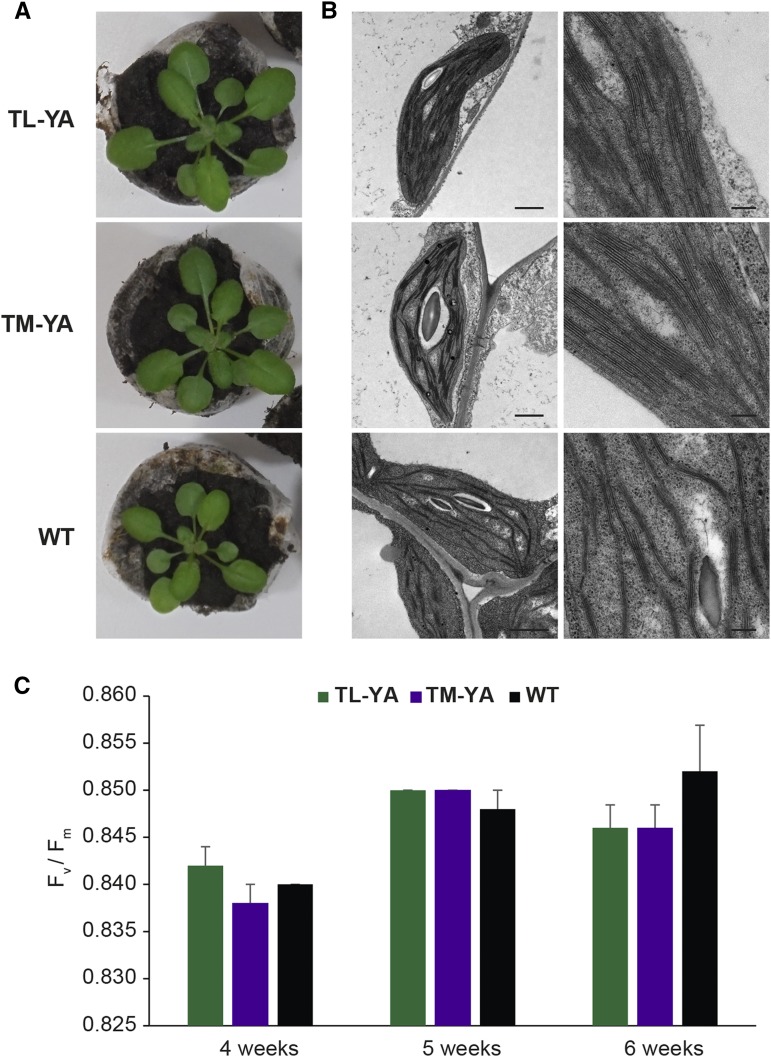
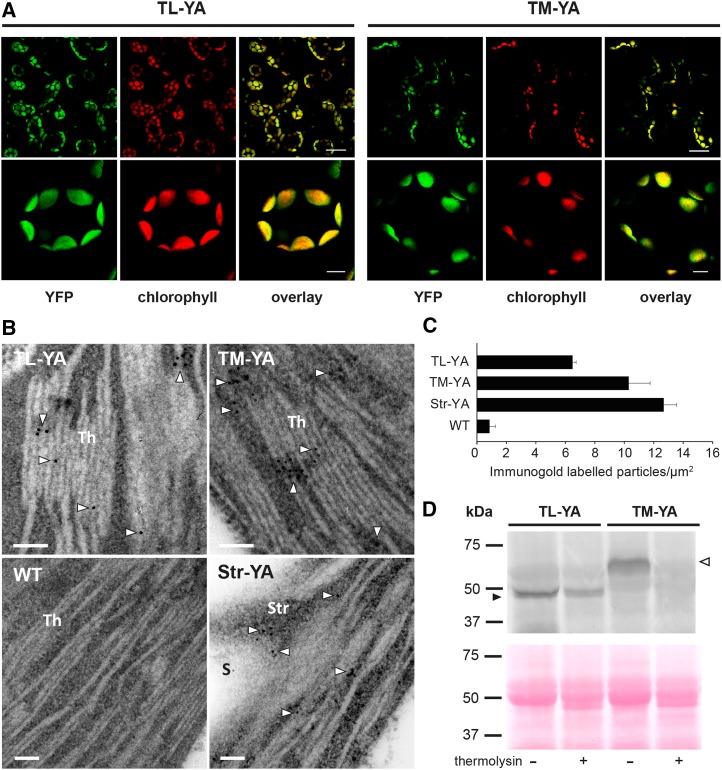
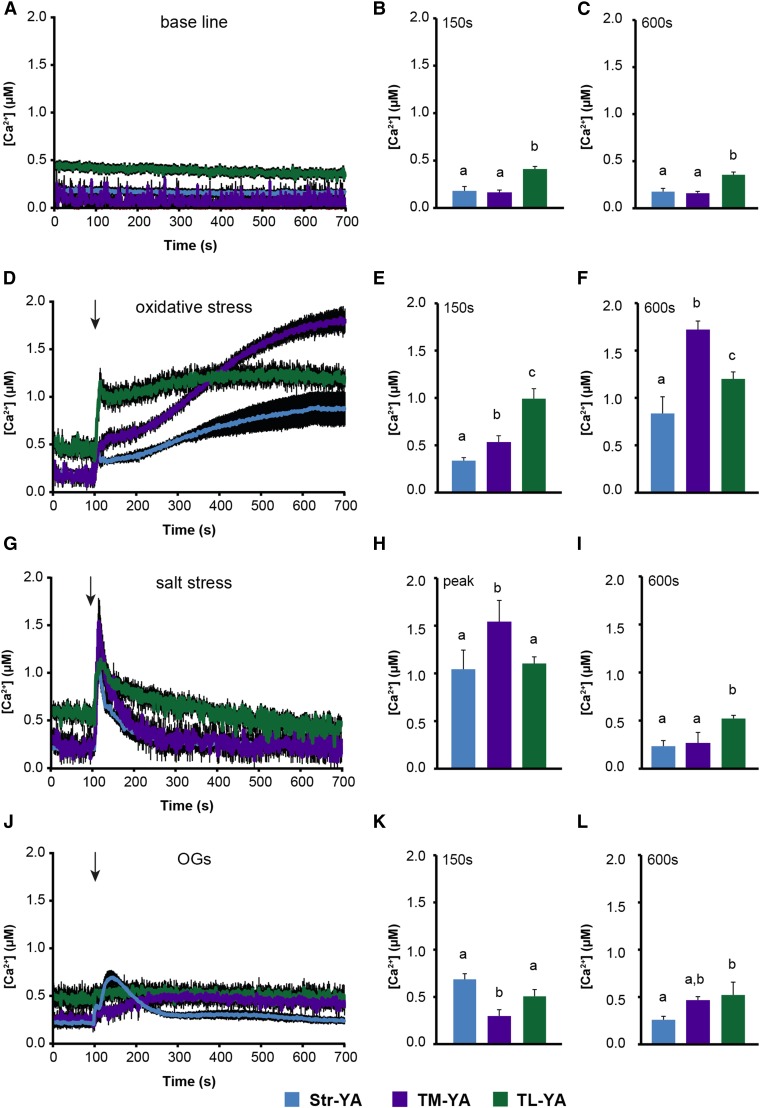
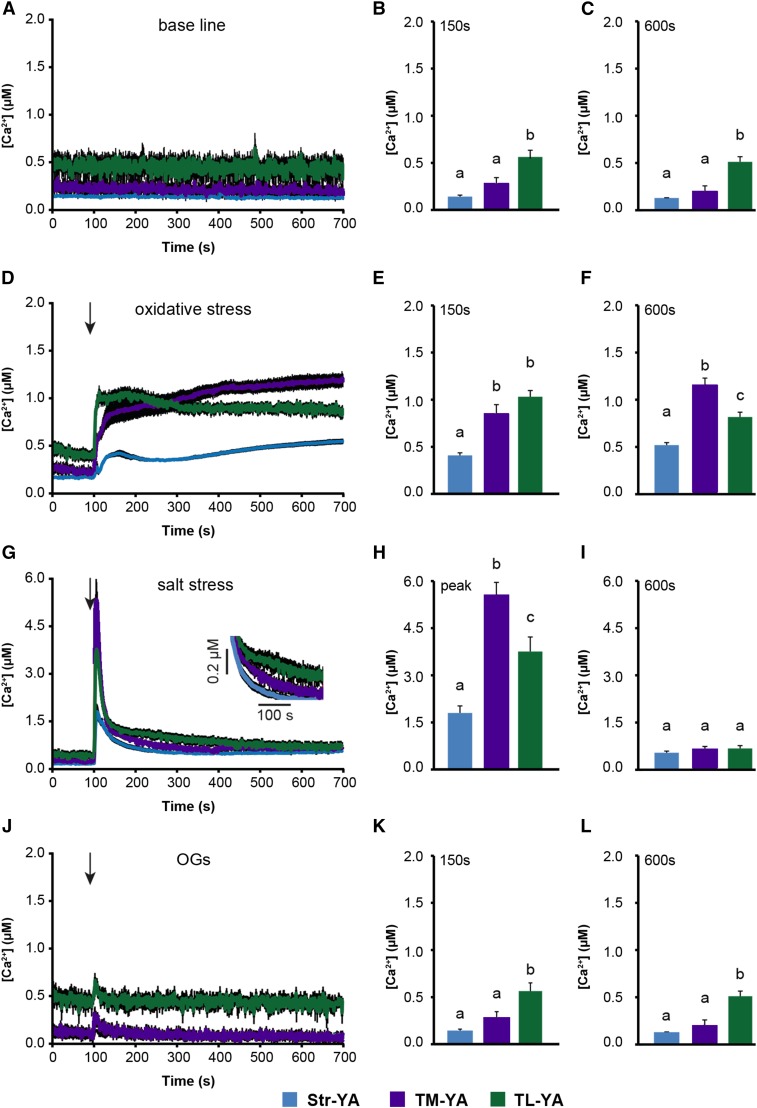
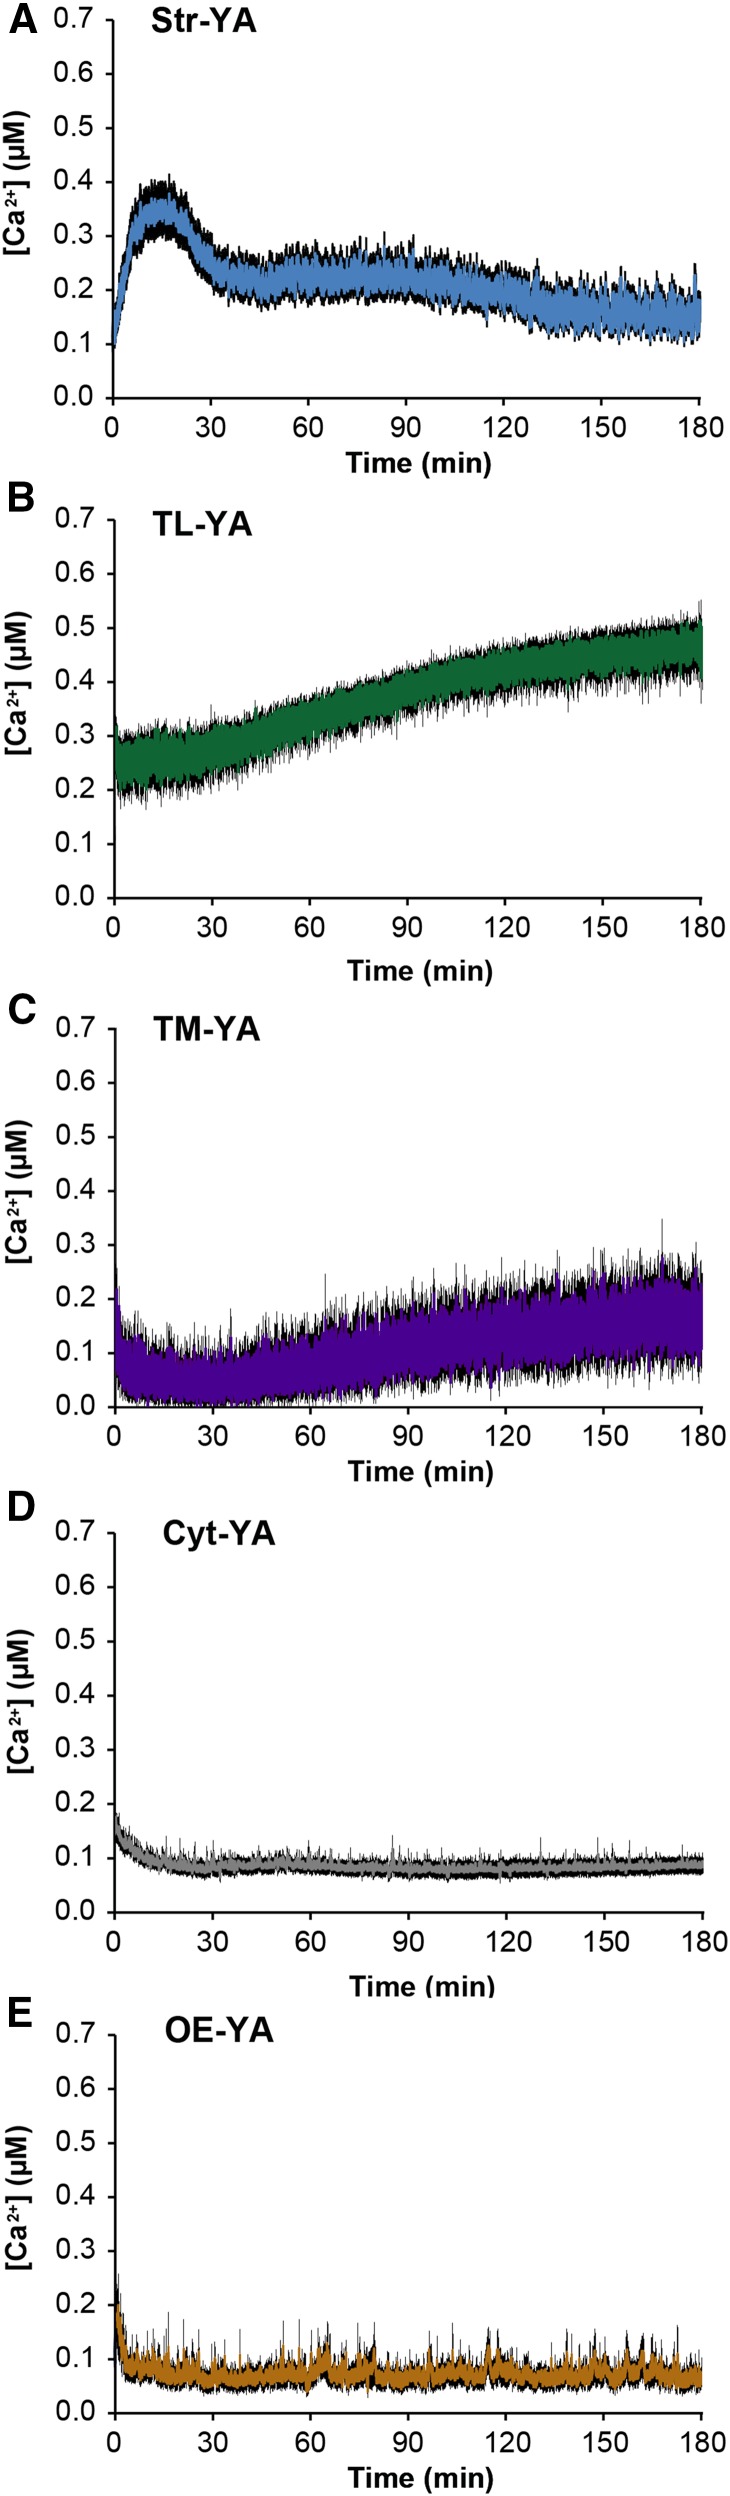
Chloroplasts require a fine-tuned control of their internal Ca2+ concentration, which is crucial for many aspects of photosynthesis and for other chloroplast-localized processes. Increasing evidence suggests that calcium regulation within chloroplasts also may influence Ca2+ signaling pathways in the cytosol. To investigate the involvement of thylakoids in Ca2+ homeostasis and in the modulation of chloroplast Ca2+ signals in vivo, we targeted the bioluminescent Ca2+ reporter aequorin as a YFP fusion to the lumen and the stromal surface of thylakoids in Arabidopsis (Arabidopsis thaliana). Thylakoid localization of aequorin-based probes in stably transformed lines was confirmed by confocal microscopy, immunogold labeling, and biochemical analyses. In resting conditions in the dark, free Ca2+ levels in the thylakoid lumen were maintained at about 0.5 μm, which was a 3- to 5-fold higher concentration than in the stroma. Monitoring of chloroplast Ca2+ dynamics in different intrachloroplast subcompartments (stroma, thylakoid membrane, and thylakoid lumen) revealed the occurrence of stimulus-specific Ca2+ signals, characterized by unique kinetic parameters. Oxidative and salt stresses initiated pronounced free Ca2+ changes in the thylakoid lumen. Localized Ca2+ increases also were observed on the thylakoid membrane surface, mirroring transient Ca2+ changes observed for the bulk stroma, but with specific Ca2+ dynamics. Moreover, evidence was obtained for dark-stimulated intrathylakoid Ca2+ changes, suggesting a new scenario for light-to-dark-induced Ca2+ fluxes inside chloroplasts. Hence, thylakoid-targeted aequorin reporters can provide new insights into chloroplast Ca2+ storage and signal transduction. These probes represent novel tools with which to investigate the role of thylakoids in Ca2+ signaling networks within chloroplasts and plant cells.


Figures

Figure 1.
Figure 1.
Overview of the cloning strategy for the creation of expression vectors targeting YA to the thylakoid lumen and thylakoid membrane, and analysis of aequorin expression in Arabidopsis transgenic lines. A and B, The targeting sequences for the thylakoid lumen (A) and for the thylakoid membrane (B) were cloned into an expression cassette in front of YA using the restriction enzymes ApaI and NotI. The complete expression cassettes were transferred subsequently into the binary vector pBIN19 carrying Basta resistance. C and D, Analysis of aequorin expression by RT-PCR (C) and immunoblotting (D) in Arabidopsis transgenic lines stably transformed with the constructs encoding TL-YA and TM-YA. For RT-PCR analyses, actin was used as a housekeeping gene. For immunoblot analyses, total protein extracts (50 μg) were separated by 10% SDS-PAGE, transferred to PVDF, and incubated with an anti-aequorin antibody (diluted 1:10,000). Black and white arrowheads indicate the YA chimeras targeted to the thylakoid lumen and the thylakoid membrane, respectively. The black arrow indicates the YA targeted to the cytosol, excluding the nucleus, in the Arabidopsis line CPK17G2A-NES-YA (Cyt-YA), used here as a positive control.
Figure 2.
Figure 2.
Phenotype, chloroplast ultrastructure, and photosynthetic activity of Arabidopsis transgenic lines stably expressing TL-YA and TM-YA. A, Representative photographs of 4-week-old seedlings of TL-YA, TM-YA, and wild-type (WT) lines. B, Transmission electron microscopy (TEM) observations of chloroplast ultrastructure, showing good preservation of thylakoids. Bars = 1 µm (left column) and 250 nm (right column). C, Pulse amplitude modulation imaging analyses of Arabidopsis seedlings at 4, 5, and 6 weeks. Data are means ± se of five independent experiments. No significant differences were observed (Student’s t test).
Figure 3.
Figure 3.
Confocal microscopy analyses, immunogold labeling, and biochemical analyses of Arabidopsis seedlings of the TL-YA and TM-YA lines. A, Fluorescence microscopy images of mesophyll cells of Arabidopsis seedling leaves with a YFP filter and a chlorophyll filter. An overlay of the two channels also is shown. Bars = 25 µm (top row) and 5 µm (bottom row). B, Immunocytochemical analyses of aequorin subcellular localization. The wild-type (WT) line and a line expressing YA in the stroma (Str-YA) were used as negative and positive controls, respectively. White arrowheads indicate gold particles. Bars = 100 nm. S, Starch granule; Str, stroma; Th, thylakoids. C, Quantitative analyses of immunogold-labeled particles. Data are means ± se of 40 different fields from three biological replicates. D, Immunoblot analyses of isolated thylakoids, incubated in the absence (−) or presence (+) of 0.1 µg µL−1 thermolysin, as indicated. Isolated thylakoids corresponding to 50 µg of protein were probed with an anti-aequorin antibody (top gel). Equal loading was confirmed by Ponceau Red staining of the blot membrane (bottom gel). Black and white arrowheads indicate YA chimeras targeted to the thylakoid lumen and the thylakoid membrane, respectively.
Figure 4.
Figure 4.
Monitoring of subchloroplast free [Ca2+] in Arabidopsis cell suspension cultures in response to environmental stimuli. Ca2+ measurements were conducted in Str-YA (blue traces), TM-YA (violet traces), and TL-YA (green traces) lines. A to C, In resting conditions. D to F, In response to 10 mm H2O2. G to I, In response to 0.3 m NaCl. J to L, In response to 20 µg mL−1 OGs. In A, D, G, and J, data are presented as means ± se (black shading) of 15 traces obtained from 15 aliquots of suspension-cultured cells derived from five independent growth replicates. Arrows indicate the time of stimulation (100 s). B, C, E, F, H, I, K, and L show statistical analyses of Ca2+ levels recorded in the different transgenic lines at two different time points: after 150 s (B, E, and K) and 600 s (C, F, I, and L). In H, the maximum [Ca2+] (at the peak) is reported. Bars labeled with different letters differ significantly (P < 0.05, Student’s t test).
Figure 5.
Figure 5.
Monitoring of subchloroplast free [Ca2+] in Arabidopsis seedlings in response to environmental stimuli. Ca2+ measurements were conducted in Str-YA (blue traces), TM-YA (violet traces), and TL-YA (green traces) lines. A to C, In resting conditions. D to F, In response to 10 mm H2O2. G to I, In response to 0.3 m NaCl. J to L, In response to 20 µg mL−1 OGs. In A, D, G, and J, data are presented as means ± se (black shading) of 15 traces obtained from 15 different plants derived from five independent growth replicates. Arrows indicate the time of stimulation (100 s). In the inset in G, a magnification of the region between 150 and 400 s is shown. B, C, E, F, H, I, K, and L show statistical analyses of Ca2+ levels recorded after 150 s (B, E, and K), after 600 s (C, F, I, and L), and at the peak (H). Bars labeled with different letters differ significantly (P < 0.05, Student’s t test).
Figure 6.
Figure 6.
Measurement of Ca2+ fluxes in response to light-to-dark transition. Ca2+ assays were conducted in Arabidopsis seedlings stably expressing YA chimeras in different subcellular locations: stroma (A; blue trace), thylakoid lumen (B; green trace), thylakoid membrane (C; violet trace), cytosol (D; gray trace), and cytosolic surface of the plastid outer envelope (E; brown trace). Data are presented as means ± se (black shading) of 15 traces obtained from 15 different plants derived from five independent growth replicates. In all graphs, the lights-off stimulus starts at time 0.

References

    1. Abdul-Awal SM, Hotta CT, Davey MP, Dodd AN, Smith AG, Webb AA (2016) NO-mediated [Ca2+]cyt increases depend on ADP-ribosyl cyclase activity in Arabidopsis. Plant Physiol 171: 623–631 - PMC - PubMed
    1. Aronsson H, Jarvis RP (2011) Rapid isolation of Arabidopsis chloroplasts and their use for in vitro protein import assays. Methods Mol Biol 774: 281–305 - PubMed
    1. Bailleul B, Berne N, Murik O, Petroutsos D, Prihoda J, Tanaka A, Villanova V, Bligny R, Flori S, Falconet D, et al. (2015) Energetic coupling between plastids and mitochondria drives CO2 assimilation in diatoms. Nature 524: 366–369 - PubMed
    1. Baker CJ, Mock NM (1994) An improved method for monitoring cell death in cell suspension and leaf disk assays using Evans blue. Plant Cell Tissue Organ Cult 39: 7–12
    1. Bellafiore S, Barneche F, Peltier G, Rochaix JD (2005) State transitions and light adaptation require chloroplast thylakoid protein kinase STN7. Nature 433: 892–895 - PubMed

Publication types

LinkOut - more resources