. 2018 Mar 20;9(1):1155.
doi: 10.1038/s41467-018-03396-5.

Microscopic mechanisms of deformation transfer in high dynamic range branched nanoparticle deformation sensors

Affiliations

Microscopic mechanisms of deformation transfer in high dynamic range branched nanoparticle deformation sensors

Shilpa N Raja et al. Nat Commun. .

Abstract

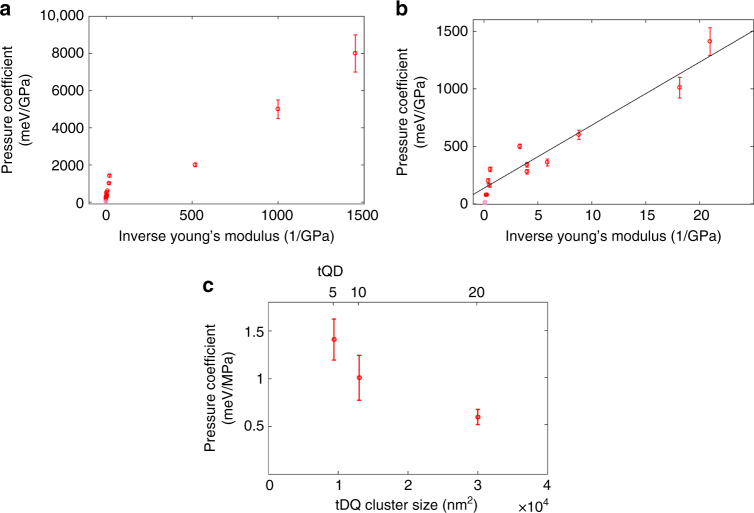
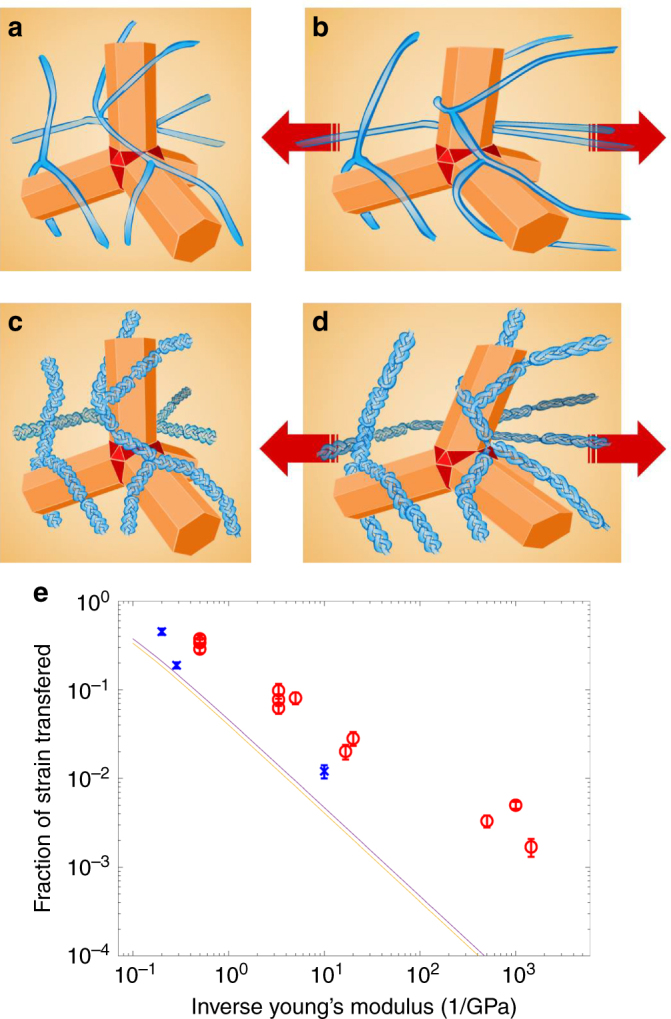
Nanoscale stress sensing is of crucial importance to biomechanics and other fields. An ideal stress sensor would have a large dynamic range to function in a variety of materials spanning orders of magnitude of local stresses. Here we show that tetrapod quantum dots (tQDs) exhibit excellent sensing versatility with stress-correlated signatures in a multitude of polymers. We further show that tQDs exhibit pressure coefficients, which increase with decreasing polymer stiffness, and vary >3 orders of magnitude. This high dynamic range allows tQDs to sense in matrices spanning >4 orders of magnitude in Young's modulus, ranging from compliant biological levels (~100 kPa) to stiffer structural polymers (~5 GPa). We use ligand exchange to tune filler-matrix interfaces, revealing that inverse sensor response scaling is maintained upon significant changes to polymer-tQD interface chemistry. We quantify and explore mechanisms of polymer-tQD strain transfer. An analytical model based on Mori-Tanaka theory presents agreement with observed trends.


Conflict of interest statement

The authors declare no competing interests.

Figures

Fig. 1
Fig. 1
tQD cluster dispersion and concentration in polymers and tQD-polymer interfaces studied in this work (see Fig. 2 for evenly dispersed tQDs in polymers). a, b Schematics of high (evenly dispersed) and low (clustered) dispersions are shown, as well as high and low concentrations in polymers wherein tQDs form clusters, and varying tQD-polymer interface chemistries. c TEM images of tQDs before polymer incorporation. d TEM image of tQD clusters in PLLA (10% by weight). e TEM image of tQD clusters in SEBS (5% by weight). f TEM image of tQD clusters in SEBS (20% by weight). All scale bars shown represent 200 nm, except for the inset to c, which is 50 nm
Fig. 2
Fig. 2
Singly dispersing tQDs into polymers. a Schematic of the two-step process to coat tQDs with thiol-terminated polymers. b, c TEM images of PLLA-coated tQDs in PLLA polymer. c Closer view. d TEM image of PLLA-coated tQDs in PEO fiber. Scale bars are b 200 nm; c 40 nm; and d 80 nm
Fig. 3
Fig. 3
Examples of opto-mechanical and mechanical tests on tQD-PBD and tQD-PCL polymer fibers. Opto-mechanical and mechanical data were acquired separately. a Optically sensed fluorescence tensile curve of tQD-PBD fibers. The x-axis is tensile strain, while the y-axis is the magnitude of the PL emission maximum red-shift. b Corresponding tensile stress–strain curve of tQD-PBD fibers measured using a typical uniaxial mechanical tensile tester. c Optically sensed fluorescence tensile curve of tQD-PCL fibers. The y-axis is the magnitude of the PL emission maximum red-shift. d Corresponding tensile stress–strain curve of tQD-PCL fibers measured using a typical uniaxial mechanical tensile tester. Engineering stress and engineering strain are plotted
Fig. 4
Fig. 4
High dynamic range of tQD pressure coefficients. a Monotonic scaling of the tQD pressure coefficient over three orders of magnitude with the polymer inverse Young’s modulus. b Plot of the initial region shown in a (inverse Young’s modulus <200/GPa). c Plot of pressure coefficient as a function of tQD cluster size for three concentrations of tQDs in SEBS. Error bars represent standard error of the mean (SEM) and each mean is the average of 10–15 measurements
Fig. 5
Fig. 5
Polymer-tQD strain transfer efficiency. a Schematic of tQD-polymer interfacial strain transfer. a, b Lower strain transfer efficiency from relatively low Young’s modulus polymers to the tQDs, while c and d depict higher strain transfer efficiency from relatively high Young’s modulus (higher stiffness depicted as analogous to a braid) polymers to tQDs. e Red circles and blue Xs indicate experimental values. Blue Xs represent systems with varied ligand-tQD surface chemistry. Polymer-tQD strain transfer efficiency as a function of inverse Young’s modulus of the polymer material. The plot shows lines that indicate our theoretical Mori-Tanaka model predictions; the yellow line represents the theoretical model with a polymer Poisson’s ratio of 0.3, while the purple line represents the theoretical model with a polymer Poisson’s ratio of 0.5. Error bars represent SEM and each mean is the average of 10–15 measurements

Similar articles

References

    1. Narayanan RA, et al. Dynamics and internal stress at the nanoscale related to unique thermomechanical behavior in polymer nanocomposites. Phys. Rev. Lett. 2006;97:075505. doi: 10.1103/PhysRevLett.97.075505. - DOI - PubMed
    1. Shiari B, Miller RE. Multiscale modeling of crack initiation and propagation at the nanoscale. J. Mech. Phys. Solids. 2016;88:35–49. doi: 10.1016/j.jmps.2015.12.003. - DOI
    1. Cheng S, et al. Unraveling the mechanism of nanoscale mechanical reinforcement in glassy polymer nanocomposites. Nano Lett. 2016;16:3630–3637. doi: 10.1021/acs.nanolett.6b00766. - DOI - PubMed
    1. Raja SN, et al. Tetrapod nanocrystals as fluorescent stress probes of electrospun nanocomposites. Nano Lett. 2013;13:3915–3922. doi: 10.1021/nl401999t. - DOI - PubMed
    1. Mu M, Osswald S, Gogotsi Y, Winey KI. An in situ Raman spectroscopy study of stress transfer between carbon nanotubes and polymer. Nanotechnology. 2009;20:335703. doi: 10.1088/0957-4484/20/33/335703. - DOI - PubMed

Publication types