. 2018 Mar 20;9(1):1151.
doi: 10.1038/s41467-018-03581-6.

Inhibitory gain modulation of defense behaviors by zona incerta

Affiliations

Inhibitory gain modulation of defense behaviors by zona incerta

Xiao-Lin Chou et al. Nat Commun. .

Abstract

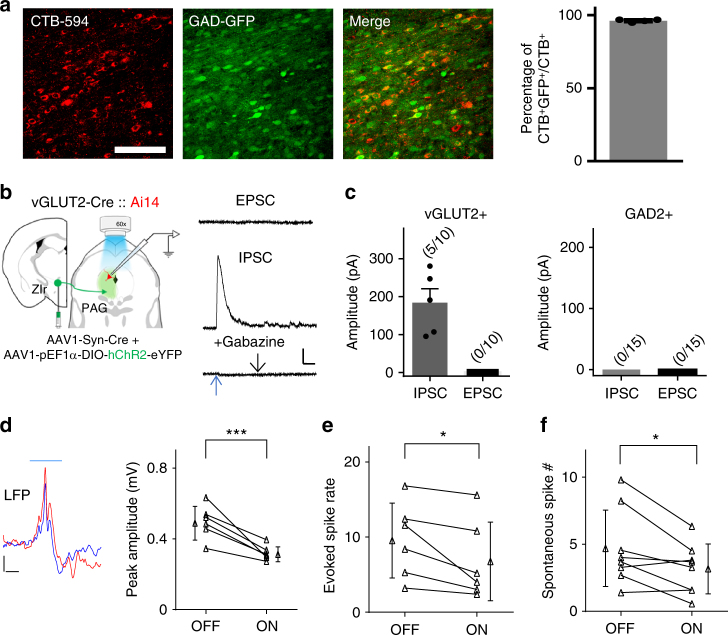
Zona incerta (ZI) is a functionally mysterious subthalamic nucleus containing mostly inhibitory neurons. Here, we discover that GABAergic neurons in the rostral sector of ZI (ZIr) directly innervate excitatory but not inhibitory neurons in the dorsolateral and ventrolateral compartments of periaqueductal gray (PAG), which can drive flight and freezing behaviors respectively. Optogenetic activation of ZIr neurons or their projections to PAG reduces both sound-induced innate flight response and conditioned freezing response, while optogenetic suppression of these neurons enhances these defensive behaviors, likely through a mechanism of gain modulation. ZIr activity progressively increases during extinction of conditioned freezing response, and suppressing ZIr activity impairs the expression of fear extinction. Furthermore, ZIr is innervated by the medial prefrontal cortex (mPFC), and silencing mPFC prevents the increase of ZIr activity during extinction and the expression of fear extinction. Together, our results suggest that ZIr is engaged in modulating defense behaviors.


Conflict of interest statement

The authors declare no competing interests.

Figures

Fig. 1
Fig. 1
A distinct GABAergic projection from ZIr to PAG. a Left three panels, co-localization of GFP (green) signal and NeuN (red) staining in the ZIr of a GAD67-GFP mouse. Scale: 200 µm. Right panel, percentage of GFP+ neurons in the rostral sector (ZIr) and more caudal part (ZIv/ZId) of ZI. b Injection of Cre-dependent GFP virus into ZIr of GAD2-Cre mice. Confocal images show GFP expression in the injection site (upper middle; scale: 500 µm) and in several target structures (upper right and lower; scale: 200 µm). Blue shows Nissl staining. ZIr zona incerta, rostral, PAG periaqueductal gray, SC superior colliculus, PRNr pontine reticular nucleus, rostral, RN red nucleus. c Injection of Cre-dependent GFP virus into ZIv/ZId of PV-Cre mice. Images show GFP expression in the injection site (upper middle; scale: 500 µm) and in several target structures (upper right and lower; scale: 200 µm). d Summary of target areas of GAD2+ ZIr (left panel) and PV+ ZIv/ZId (right panel) neurons. PO posterior complex of the thalamus, APN anterior pretectal nucleus, MRN midbrain reticular nucleus, MARN magnocellular reticular nucleus
Fig. 2
Fig. 2
ZIr bi-directionally modulates noise-induced flight response. a Upper, illustration of the experimental paradigm. Lower, image showing ChR2 expression (green) and placement of two optic fibers over ZIr. Scale: 1000 µm. b Normalized average speed induced by noise sound for an example ChR2-expressing animal with (blue) and without (gray) blue LED stimulation. Two dash lines mark the duration of noise. c Summary of noise-induced peak speed without (OFF) and with (ON) activation of ZIr neurons. ***p = 0.001, two-sided paired t-test, n = 11 animals. d Summary of total travel distance during the 5-s noise stimulation without and with activation of ZIr neurons. ***p = 0.003, two-sided Wilcoxon signed-rank test, n = 11. e Upper, illustration of the experimental paradigm. Lower, image showing ArchT expression (green) and placement of two optic fibers over ZIr. Scale: 1000 µm. f Normalized average speed induced by noise for an example ArchT-expressing animal with (green) and without (gray) green LED stimulation. g Summary of noise-induced peak speed without and with suppressing ZIr neurons. *p = 0.019, two-sided paired t-test, n = 9 animals. h Summary of total travel distance without and with suppressing ZIr. *p = 0.032, two-sided paired t-test, n = 9 animals. Solid symbol represents mean ± s.d. for all panels
Fig. 3
Fig. 3
ZIr activity exerts a gain modulation. a Average peak speeds induced by noise of different intensities without (black) and with (blue) activation of ZIr neurons for an example animal. Inset, illustration of experimental setup. b Left, peak speed in the LED on condition versus that in the LED off condition plotted for three animals. Each color represents one animal. Colored lines represent the corresponding linear regression line. Black dash line is the unity line. Right, correlation coefficient calculated for each animal (upper) and the slope for the best-fit linear regression line (lower). c Average peak speeds induced by noise of different intensities without (black) and with (green) suppression of ZIr neurons for an example animal. d Speed with ZIr suppression versus that without suppression plotted for four animals
Fig. 4
Fig. 4
ZIr bidirectionally modulates conditioned freezing response. a Experimental paradigm for fear conditioning and testing of learned freezing response. b Percentage of time freezing during presentations of CS alone without and with activation of ZIr. ***p < 0.001, two-sided paired t-test, n = 10 animals. c Percentage of time freezing during presentations of CS alone without and with suppressing ZIr. **p = 0.005, two-sided paired t-test, n = 7 animals. d Percentage of time freezing at each presentation of CS during extinction training with (green) and without (black) suppressing ZIr. Scale bar = s.e., n = 5 for ArchT and 7 for control. e Modulation index calculated for each animal (as the ratio of freezing time between the last and first trial) for the GFP control and ArchT suppression group. ***p = 0.004, two-sided unpaired t-test, n = 5 for ArchT and 7 for control. Solid symbol represents mean ± s.d. for all panels
Fig. 5
Fig. 5
ZIr activities during fear conditioning and fear extinction. a Left, experimental setup for extracellular recording. Right, principal component analysis for an example recording session. The graph shows the projection of principal components to the PC1–PC3 plane. Colors mark different clusters of the spikes. Dashed circles denote the boundary of well separated spikes. b Raster plot of spikes for an example ZIr unit during CS presentation (19 s, just before the foot shock). Scale: 2 s. c Average normalized spike rate of ZIr units during fear induction, n = 12 units from four animals. d Raster plot of spikes for example units during the first and last three presentations of CS alone in an example conditioned and non-conditioned control mouse respectively. Scale: 0.5 s. Inset, superimposed 50 individual spikes and their average (black) for the corresponding unit. Scale: 20 µV, 0.5 ms. e Average normalized spike rate of ZIr units at each CS presentation in conditioned (black, n = 11 units from six animals) and control (gray, n = 18 units from six animals) mice. ***p(trial5) < 0.001, *p(trial6) = 0.031, ***p(trial8) = 0.003, ***p(trial9) < 0.001, **p(trial10) = 0.006, two-sided Mann–Whitney U test. f Modulation index calculated for each unit for the conditioned and control groups. ***p < 0.001, two-sided unpaired t-test. Solid symbol represents mean ± s.e.m. for all panels
Fig. 6
Fig. 6
mPFC contributes to ZIr activity increase during extinction. a Injection of rAAV2-retro-syn-Cre into ZIr of Ai14 mouse. Left, tdTomato expression around the injection site. Right, retrogradely labeled presynaptic neurons (red) in mPFC. Blue shows Nissl staining. ILA and PL subregions are marked. Scale: 500 µm. b Injection of GFP virus into mPFC of wild-type mice. Left, GFP expression at the injection site. Middle, GFP-labeled axons in ZIr. Right, no GFP-labeled axons in the more caudal part of ZI. Scale: 500 µm. c Left, experimental paradigm. Right, average EPSC amplitudes of 15 out of 25 recorded ZIr neurons in response to LED activation of mPFC axons. Recording was made in the presence of TTX and 4-AP. Top inset, average EPSC trace for an example ZIr neuron. Arrow points to the onset of LED. Scale: 40 pA, 10 ms. d Average normalized spike rate of ZIr units during extinction training for saline control (black, n = 21 units from seven animals) and mPFC muscimol injected (green, n = 16 units from six animals) mice. ***p(trial 8) < 0.001, **p(trial9) = 0.002, ***p(trial10) < 0.001, two-sided Mann–Whitney U test. e Modulation index calculated for each unit in the saline and muscimol group. ***p < 0.001, two-sided unpaired t-test. Solid symbol represents mean ± s.e.m. for all panels
Fig. 7
Fig. 7
GABAergic output of ZIr suppresses PAG activity. a Left three panels, co-localization of GFP (green) with CTB (red) retrogradely transported from PAG in the ZIr of a GAD67-GFP mouse. Scale: 200 µm. Right panel, percentage of GAD-GFP+ neurons in total CTB labeled neurons in ZIr. b Left, slice recording paradigm. Excitatory neurons are labeled by red color in vGLTU2-Cre::Ai14 mice. Right, average EPSC (recorded at −70 mV) and IPSC (recorded at 0 mV) traces of a vGLUT2+ neuron in PAG. The IPSC was blocked by Gabazine (bottom). Blue arrow points to the onset of LED. Scale: 50 pA, 50 ms. c Average amplitudes of LED-evoked IPSCs and EPSCs in excitatory (left) and inhibitory (right) PAG neuron populations. d Left, average local field potential recorded in PAG in response to noise without (red) and with (blue) LED stimulation in a ZIr ChR2 expressing mouse. Right, summary of peak amplitude of LFP recorded in PAG without (OFF) and with (ON) activation of ZIr. ***p = 0.004, two-sided paired t-test, n = 6 sites from two animals. e Summary of noise-evoked spike rate in PAG without and with ZIr activation. *p = 0.028, two-sided Wilcoxon signed-rank test, n = 6 sites from two animals. f Summary of spontaneous firing rate in PAG without and with ZIr activation. *p = 0.03, two-sided paired t-test, n = 8 sites from two animals. Solid symbol represents mean ± s.d. for d, e, f, and mean ± s.e.m. for a, c
Fig. 8
Fig. 8
The ZIr-PAG projection mediates the modulatory effects on defense behaviors. a Experimental paradigm. LED was applied to PAG, and muscimol was injected into ZIr as to prevent antidromic stimulation. b Normalized average speed responding to noise without (gray) and with (blue) LED stimulation plotted for an example animal. c Summary of noise-induced peak speed without and with activation of ZIr-PAG projections. ***p = 0.003, two-sided paired t-test, n = 8 animals. d Summary of noise-induced travel distance without and with activation of ZIr-PAG projections. *p = 0.021, two-sided paired t-test, n = 8 animals. e Percentage of time freezing during presentations of CS alone without and with activation of ZIr-PAG projections in conditioned mice. ***p < 0.001, two-sided paired t-test, n = 10 animals. Solid symbol represents mean ± s.d. for all panel

Similar articles

Cited by

References

    1. Forel, A. Untersuchungen über die Haubenregion und ihre oberen Verknüpfungen im Gehirne des Menschen und einiger Säugethiere, mit Beiträgen zu den Methoden der Gehirnuntersuchung. In Archiv für Psychiatrie und Nervenkrankheiten, 7, 393–495 (1877)
    1. Mitrofanis J. Some certainty for the ‘zone of uncertainty’? Exploring the function of the zona incerta. Neuroscience. 2005;130:1–15. doi: 10.1016/j.neuroscience.2004.08.017. - DOI - PubMed
    1. Zhang X, van den Pol AN. Rapid binge-like eating and body weight gain driven by zona incerta GABA neuron activation. Science. 2017;356:853–859. doi: 10.1126/science.aam7100. - DOI - PMC - PubMed
    1. Moon HC, Park YS. Reduced GABAergic neuronal activity in zona incerta causes neuropathic pain in a rat sciatic nerve chronic constriction injury model. J. Pain Res. 2017;10:1125–1134. doi: 10.2147/JPR.S131104. - DOI - PMC - PubMed
    1. Liu K, et al. Lhx6-positive GABA-releasing neurons of the zona incerta promote sleep. Nature. 2017;548:582–587. doi: 10.1038/nature23663. - DOI - PMC - PubMed

Publication types

LinkOut - more resources