. 2018 Mar 20;8(1):4857.
doi: 10.1038/s41598-018-23259-9.

Identification of di-substituted ureas that prevent growth of trypanosomes through inhibition of translation initiation

Affiliations

Identification of di-substituted ureas that prevent growth of trypanosomes through inhibition of translation initiation

Fabricio Castro Machado et al. Sci Rep. .

Abstract

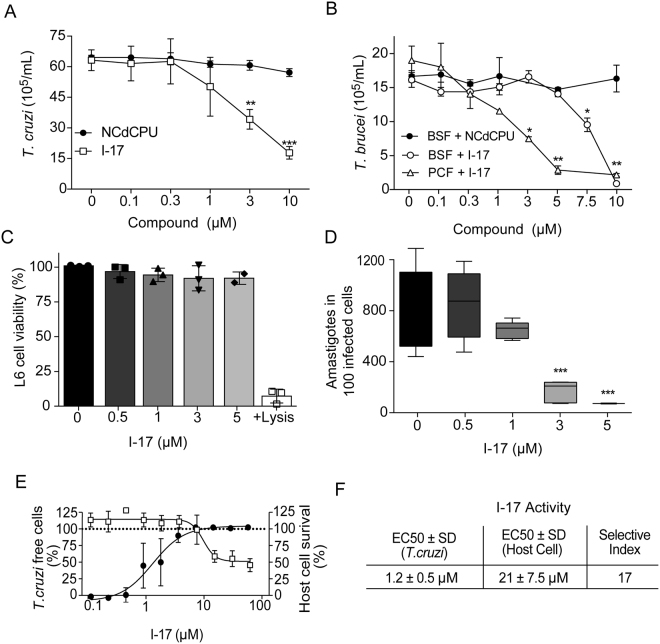
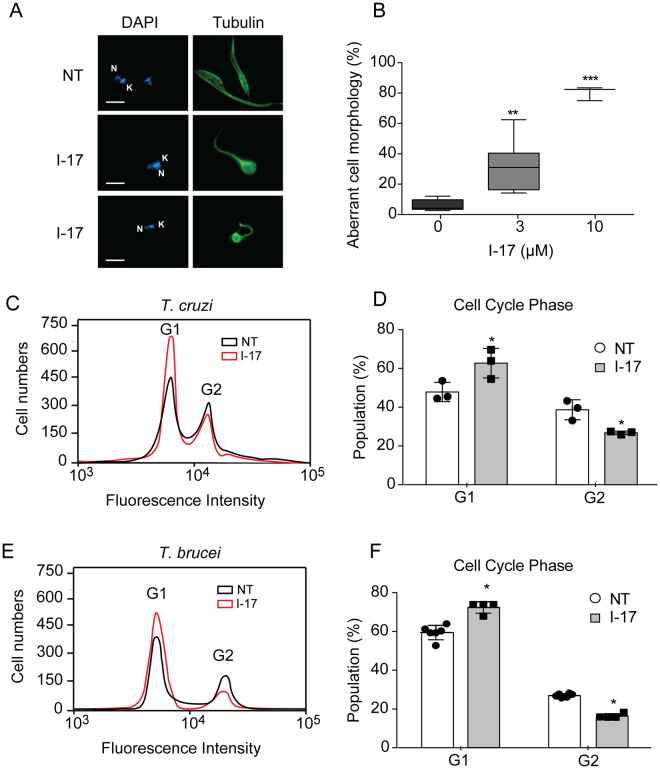
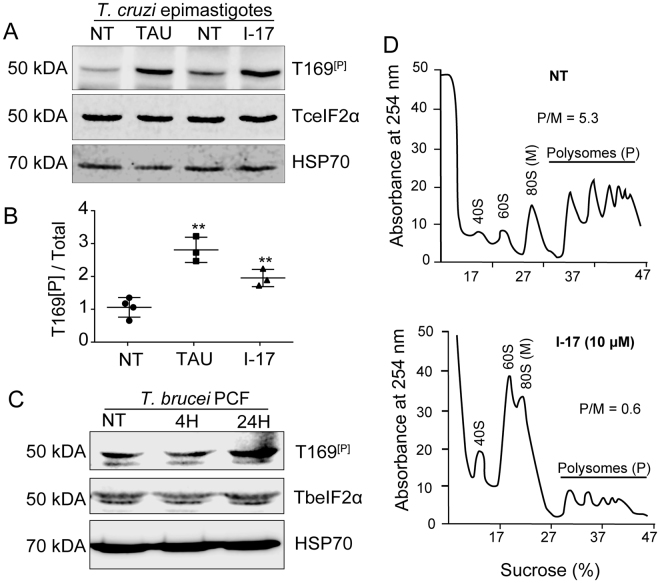
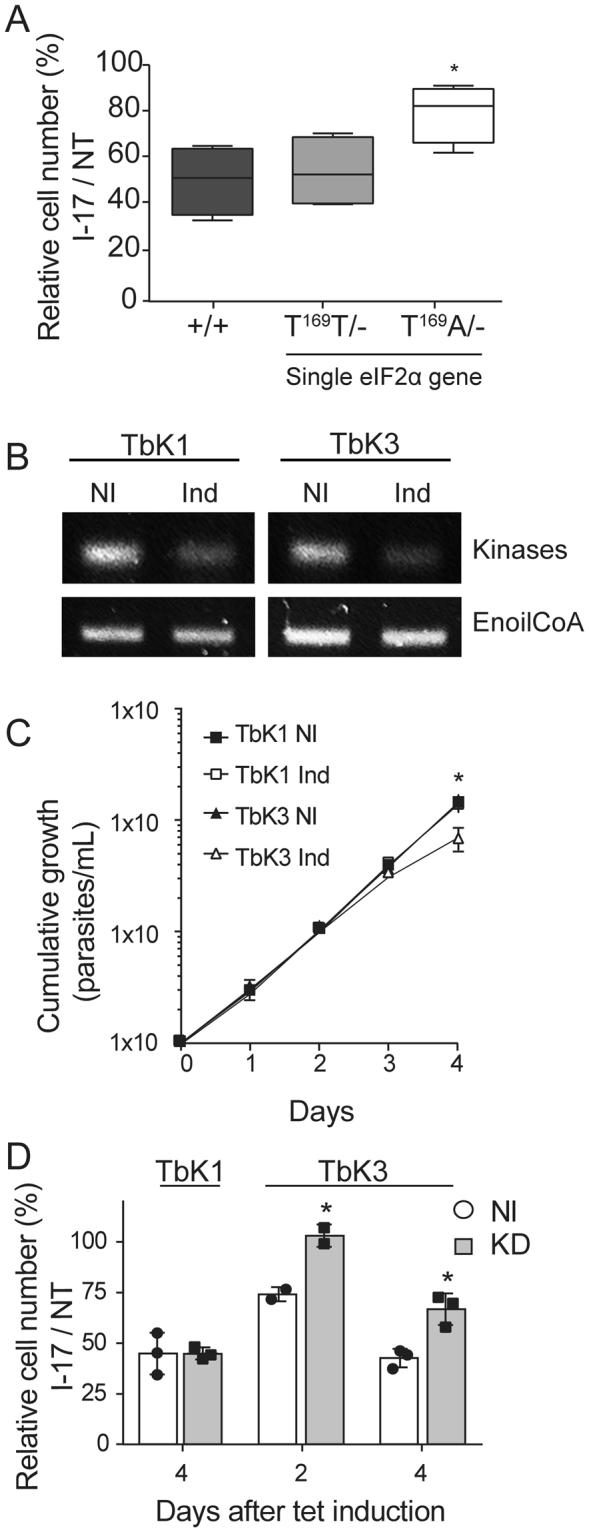
Some 1,3-diarylureas and 1-((1,4-trans)-4-aryloxycyclohexyl)-3-arylureas (cHAUs) activate heme-regulated kinase causing protein synthesis inhibition via phosphorylation of the eukaryotic translation initiation factor 2 (eIF2) in mammalian cancer cells. To evaluate if these agents have potential to inhibit trypanosome multiplication by also affecting the phosphorylation of eIF2 alpha subunit (eIF2α), we tested 25 analogs of 1,3-diarylureas and cHAUs against Trypanosoma cruzi, the agent of Chagas disease. One of them (I-17) presented selectivity close to 10-fold against the insect replicative forms and also inhibited the multiplication of T. cruzi inside mammalian cells with an EC50 of 1-3 µM and a selectivity of 17-fold. I-17 also prevented replication of African trypanosomes (Trypanosoma brucei bloodstream and procyclic forms) at similar doses. It caused changes in the T. cruzi morphology, arrested parasite cell cycle in G1 phase, and promoted phosphorylation of eIF2α with a robust decrease in ribosome association with mRNA. The activity against T. brucei also implicates eIF2α phosphorylation, as replacement of WT-eIF2α with a non-phosphorylatable eIF2α, or knocking down eIF2 protein kinase-3 by RNAi increased resistance to I-17. Therefore, we demonstrate that eIF2α phosphorylation can be engaged to develop trypanosome-static agents in general, and particularly by interfering with activity of eIF2 kinases.


Conflict of interest statement

The authors declare no competing interests.

Figures

Figure 1
Figure 1
Replication of T. cruzi and T. brucei forms are inhibited by I-17. (A) T. cruzi epimastigotes were inoculated at 2 × 106 parasites per mL and incubated at 28 °C in LIT medium containing the indicated concentrations of NCPdCPU (an inactive 1,3-diarylurea, circles) or I-17 (squares). The numbers are means ± standard deviation (n = 3) of parasite counted after 48 hours of incubation. (B) T. brucei BSF (circles) and PCF (triangles) were inoculated at 2 × 105 parasites per mL in their respective culture media in the presence of the indicated concentrations of I-17, or NCPdCPU (closed symbols). The numbers are means ± standard deviation (n = 3) of parasites counted after 24 hours at 37 °C and 48 hours at 28 °C, respectively for BSF and PCF. (C) Relative viability of L6 myoblasts measured by activity of lactate dehydrogenase released after 72 hours in the presence of the indicated concentrations of I-17. (D) TCT was used to infect L6 cells. After infection the cells were treated for 72 hours with the indicated concentrations of I-17 and the number of intracellular amastigotes was determined by optical microscopy as described in Methods. The bars represent means ± standard deviation of three independent experiments. In all panels, *indicate p < 0.05, **p < 0.01 and ***p < 0.001 calculated using the Student’s T-test comparing to non-treated cells. (E) Serial dilutions of I-17 was used to treat U-2 OS cells infected with T. cruzi TCT. Compound activity is indicated as percentage of parasite free cells (black circles) and the host cell survival (empty squares), both calculated as described in Methods. (F) Calculation of EC50 values for T. cruzi and host cells expressed in µM are also explained in Methods. The values in (E) and (F) represent means ± standard deviation of three independent experiments.
Figure 2
Figure 2
I-17 treatment causes aberrant morphology and G1 cell cycle arrest. (A) Epimastigotes non-treated (NT) or treated with 3 µM of I-17 for 4 hours were immunostained for β-tubulin (green) and labeled with DAPI to show the nucleus (N) and kinetoplast (K) (blue). Bars = 5 µM. (B) Percentage of epimastigotes with aberrant morphology after 4 hours treatment with the indicated concentrations of I-17. Boxes are representation of median ± max and min values. **p < 0.01 and ***p < 0.001 were calculated using Mann-Whitney U-test and Student’s T-test by comparing treated with non-treated cells. Flow cytometry of T. cruzi epimastigotes (C) and T. brucei PCF (E) non-treated (NT, black line) or treated for 16 hours with I-17 at 10 µM (red line) stained with propidium iodide before flow cytometry analysis. Cell population in G1 and G2 phases are indicated. Percentage of population from T. cruzi epimastigotes (D) and T. brucei PCF (F) in G1 and G2 cell cycle phases in presence (grey bars) or absence (empty bars) of I-17 are also displayed. The values are means ± standard deviation of triplicate experiments and were analyzed with Student´s t-test with *p < 0.05.
Figure 3
Figure 3
I-17 causes eIF2α phosphorylation and translational initiation impairment. (A) Total extracts of exponentially growing T. cruzi epimastigotes (NT), submitted to nutritional stress (TAU), or treated with 10 µM of I-17 for 4 hours were analyzed by immunoblotting using antibodies against the phosphorylated threonine 169 of eIF2α (T169[P]), anti-TceIF2α, and anti-HSP70. The original figures are depicted in as Supplementary Figure 2. (B) Ratio between phosphorylated (T169[P]) and the total TceIF2α intensity signal. The values are mean ± standard deviation of triplicate experiments and **indicates p < 0.01 calculated using the Student’s t-test. (C) Total extracts of exponentially growing T. brucei procyclics (NT) were submitted to 10 µM of I-17 for 4 or 24 hours and analyzed by immunoblotting using antibodies against the phosphorylated threonine 169 of eIF2α (T169[P]), anti-TceIF2α used to detect TbeIF2α, and anti-HSP70. (D) Polysome profiles in sucrose gradients measured at 254 nm of epimastigotes non-treated (NT) or treated with I-17 at 10 µM. The migrating position of the ribosomal subunits (40S and 60S), monosomes (80S) and polysomes (P) is indicated in each panel. The P/M ratios were obtained by measuring the graphic area under both fractions.
Figure 4
Figure 4
I-17 inhibition depends on phosphorylatable eIF2α and a specific eIF2α kinase. (A) Relative cell numbers after 24 hours were measured in percentages by dividing the total number of T. brucei BSF treated with 5 µM of I-17 by the cell number of the appointed lineages maintained without I-17 (NT). (+/+) corresponds to a parental BSF line, (T169T/−) to BSF containing a single wild type eIF2α gene, and (T169A/−) to BSF containing one alelle of eIF2α gene mutated for alanine at T169. The boxes are means ± min and max values of quadruplicate experiments. *Indicates p < 0.05 calculated using the Student’s t-test. (B) RT-PCR of total RNA extracted from PCF stably transfected using p2T7-177 with segments of TbK1 and TbK3 kinases after four days without (NI) or with tetracycline-induction for RNAi expression (Ind). The top panels show a PCR using primers for TbK1 and TbK3, and the bottom panels using primers for the enoyl-CoA as an expression control. The original gels are shown in the Supplementary Figure 3. (C) Cumulative growth curve of TbK1 (squares) and TbK3 (triangles) PCF lineages without (NI) or with tetracycline (Ind) for RNAi induction. The values in (C) are means ± standard deviation of triplicate and independent experiments. (D) Relative cell numbers in percentages measured as the ratio of total cell numbers of cultures treated with 3 µM I-17 and non-treated cultures (NT), using both TbK1 and TbK3 lineages non-induced with tetracycline (NI, empty bars) or after RNAi induction (Ind, grey bars). I-17 treatment was maintained for 48 hours and initiated 2 or 4 days after tetracycline addition. The values in (D) are means ± standard deviation of triplicate and independent experiments. *Indicates p < 0.05 calculated using the Student’s t-test.

Similar articles

Cited by

References

    1. Coura JR, Borges-Pereira J. Chagas disease: 100 years after its discovery. A systemic review. Acta Trop. 2010;115:5–13. doi: 10.1016/j.actatropica.2010.03.008. - DOI - PubMed
    1. Coura JR. Present situation and new strategies for Chagas disease chemotherapy: a proposal. Mem. Inst. Oswaldo Cruz. 2009;104:549–554. doi: 10.1590/S0074-02762009000400002. - DOI - PubMed
    1. Guedes PM, Silva GK, Gutierrez FR, Silva JS. Current status of Chagas disease chemotherapy. Expert Rev. Anti. Infect. Ther. 2011;9:609–620. doi: 10.1586/eri.11.31. - DOI - PubMed
    1. Babokhov P, Sanyaolu AO, Oyibo WA, Fagbenro-Beyioku AF, Iriemenam NC. A current analysis of chemotherapy strategies for the treatment of human African trypanosomiasis. Pathog. Glob. Health. 2013;107:242–252. doi: 10.1179/2047773213Y.0000000105. - DOI - PMC - PubMed
    1. Castro JA, de Mecca MM, Bartel LC. Toxic side effects of drugs used to treat Chagas’ disease (American trypanosomiasis) Hum. Exp. Toxicol. 2006;25:471–479. doi: 10.1191/0960327106het653oa. - DOI - PubMed

Publication types

MeSH terms

LinkOut - more resources