

Impact of Different Visual Field Testing Paradigms on Sample Size Requirements for Glaucoma Clinical Trials
- PMID: 29559700
- PMCID: PMC5861110
- DOI: 10.1038/s41598-018-23220-w
Impact of Different Visual Field Testing Paradigms on Sample Size Requirements for Glaucoma Clinical Trials
Abstract
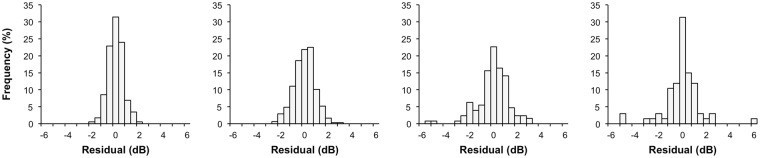
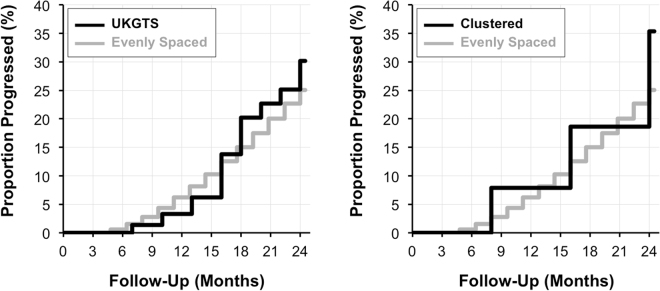
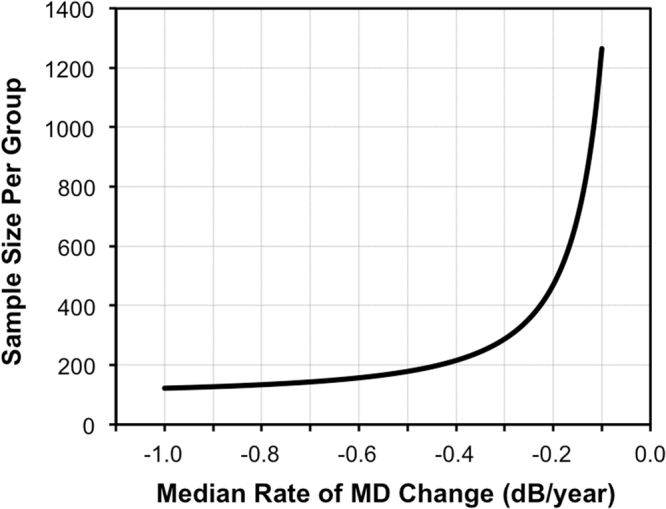
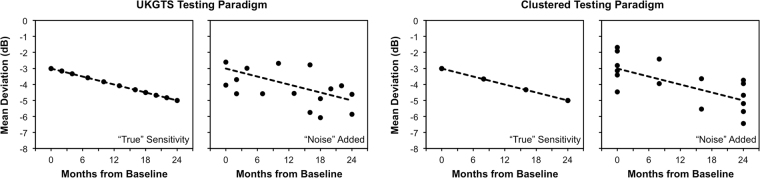
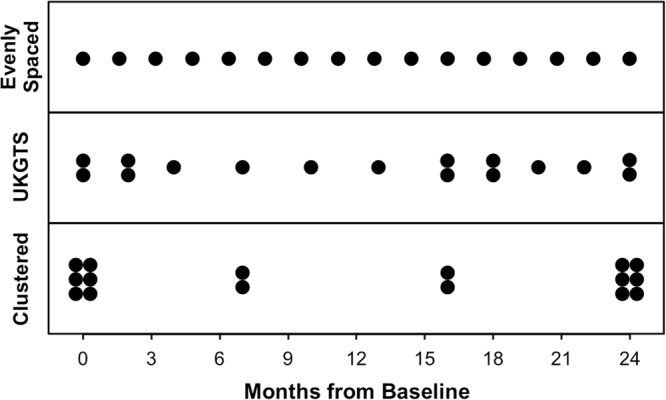
Visual field testing is an important endpoint in glaucoma clinical trials, and the testing paradigm used can have a significant impact on the sample size requirements. To investigate this, this study included 353 eyes of 247 glaucoma patients seen over a 3-year period to extract real-world visual field rates of change and variability estimates to provide sample size estimates from computer simulations. The clinical trial scenario assumed that a new treatment was added to one of two groups that were both under routine clinical care, with various treatment effects examined. Three different visual field testing paradigms were evaluated: a) evenly spaced testing, b) United Kingdom Glaucoma Treatment Study (UKGTS) follow-up scheme, which adds clustered tests at the beginning and end of follow-up in addition to evenly spaced testing, and c) clustered testing paradigm, with clusters of tests at the beginning and end of the trial period and two intermediary visits. The sample size requirements were reduced by 17-19% and 39-40% using the UKGTS and clustered testing paradigms, respectively, when compared to the evenly spaced approach. These findings highlight how the clustered testing paradigm can substantially reduce sample size requirements and improve the feasibility of future glaucoma clinical trials.
Conflict of interest statement
Zhichao Wu: none; Felipe A. Medeiros: Financial support – Alcon Laboratories (Fort Worth, TX), Bausch & Lomb (Garden City, NY), Carl Zeiss Meditec (Jena, Germany), Heidelberg Engineering (Heidelberg, Germany), Merck (White House Station, NJ), Allergan (Irvine, CA), Sensimed (Lausanne, Switzerland), Topcon (Livermore, CA), Reichert (Dewey, NY), National Eye Institute (Bethesda, MD); Research support – Alcon Laboratories (Fort Worth, TX), Allergan (Irvine, CA), Carl Zeiss Meditec (Jena, Germany), Reichert (Dewey, NY); Consultant – Allergan (Irvine, CA), Carl-Zeiss Meditec (Jena, Germany), Novartis (Basel, Switzerland). These funders had no role in the design and conduct of the study, collection, management, analysis, and interpretation of the data, preparation, review, or approval of the manuscript, or the decision to submit the manuscript for publication.
Figures
References
-
- Chauhan BC, Johnson CA. Test-retest variability of frequency-doubling perimetry and conventional perimetry in glaucoma patients and normal subjects. Invest. Ophthalmol. Vis. Sci. 1999;40:648–656. - PubMed
Publication types
MeSH terms
LinkOut - more resources
Full Text Sources
Other Literature Sources
Medical
