. 2018 Feb 12;14(3):253-265.
doi: 10.7150/ijbs.23489. eCollection 2018.

Instillation of particulate matter 2.5 induced acute lung injury and attenuated the injury recovery in ACE2 knockout mice

Affiliations

Instillation of particulate matter 2.5 induced acute lung injury and attenuated the injury recovery in ACE2 knockout mice

Chung-I Lin et al. Int J Biol Sci. .

Abstract

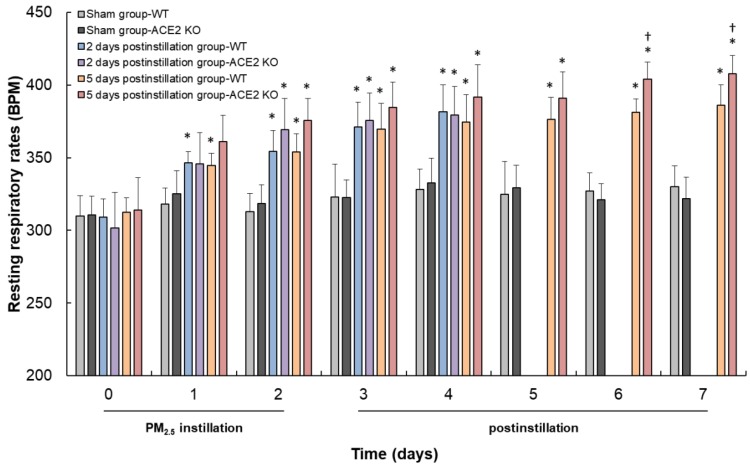
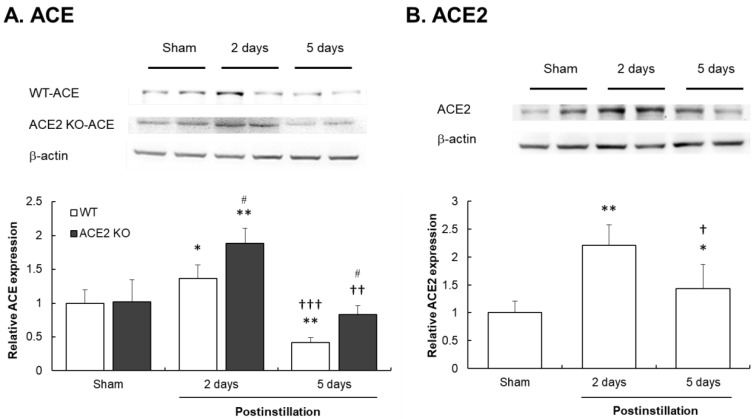
Inhaled particulate matter 2.5 (PM2.5) can cause lung injury by inducing serious inflammation in lung tissue. Renin-angiotensin system (RAS) is involved in the pathogenesis of inflammatory lung diseases and regulates inflammatory response. Angiotensin-converting enzyme II (ACE2), which is produced through the angiotensin-converting enzyme (ACE)/angiotensin II (Ang II) axis, protects against lung disease. However, few studies have focused on the relationships between PM2.5 and ACE2. Therefore, we aimed to explore the role of ACE2 in PM2.5-induced acute lung injury (ALI). An animal model of PM2.5-induced ALI was established with wild type (C57BL/6, WT) and ACE2 gene knockout (ACE2 KO) mice. The mice were exposed to PM2.5 through intratracheal instillation once a day for 3 days (6.25 mg/kg/day) and then sacrificed at 2 days and 5 days after PM2.5 instillation. The results show that resting respiratory rate (RRR), levels of inflammatory cytokines, ACE and MMPs in the lungs of WT and ACE2 KO mice were significantly increased at 2 days postinstillation. At 5 days postinstillation, the PM2.5-induced ALI significantly recovered in the WT mice, but only partially recovered in the ACE2 KO mice. The results hint that PM2.5 could induce severe ALI through pulmonary inflammation, and the repair after acute PM2.5 postinstillation could be attenuated in the absence of ACE2. Additionally, our results show that PM2.5-induced ALI is associated with signaling p-ERK1/2 and p-STAT3 pathways and ACE2 knockdown could increase pulmonary p-STAT3 and p-ERK1/2 levels in the PM2.5-induced ALI.

Keywords: acute lung injury; angiotensin-converting enzyme II; inflammation; particulate matter 2.5; renin-angiotensin system.


Conflict of interest statement

Competing Interests: The authors have declared that no competing interest exists.

Figures

Figure 1
Figure 1
TEM images of PM2.5 configuration. Configurations of the particulates collected from traffic were shown under transmission electron microscopy. The small particles which were 500 nm in size (A) distributed in many types (B) (C) and formed PM2.5 (D). Few particles showed other different composition such as silicon (E) or sulfur (F).
Figure 2
Figure 2
Changes in the body weight of WT and ACE2 KO mice. WT (C57BL/6, n = 7 for each group) and ACE2 KO mice (n = 7 for each group) treated with PM2.5 or saline by intratracheal administration for consecutive 3 days and sacrificed at 2 and 5 days postinstillation. Body weight of WT (A) and ACE2 KO mice (B) were detected every day until sacrifice. All values are expressed as the mean from each group; * p < 0.05, ** p < 0.01 and *** p < 0.001 compared with the body weight in the same day.
Figure 3
Figure 3
Changes in the RRR of WT and ACE2 KO mice. The RRR of WT and ACE2 KO mice were measured every day until sacrifice. The RRR increased after PM2.5 administration, and RRR of ACE2 KO mice was higher than RRR of WT mice at 6 days and 7 days. All values are expressed as the mean ± SD from each group; * p < 0.05 compared with the initial (i.e., 0 day) RRR in the same group; † p < 0.05 compared with RRR of ACE2 KO mice to RRR of WT mice in the same day.
Figure 4
Figure 4
Cytokines expression in the lungs of ACE2 KO mice after PM2.5 treatment. WT mice and ACE2 KO mice treated with PM2.5 for consecutive 3 days and sacrificed at 2 and 5 days postinstillation. The expressions of IL-6 (A), TGF-β1 (B) and TNF-α (C) in isolated lung tissue were determined by ELISA. All values are expressed as the mean ± SD from each group; * p < 0.05, ** p < 0.01 and *** p < 0.001 compared with the Sham value in the same group; † p < 0.05 and †† p < 0.01 compared with the value of 5 days to 2 days postinstillation in same group; # p < 0.05 compared with the value of ACE2 KO mice to WT mice in the same day.
Figure 5
Figure 5
Immunohistochemistry staining for TGF-β1 expression in bronchial tissue from ACE2 KO mice after PM2.5 treatment. The TGF-β1 (dark brown) of WT (A) and ACE2 KO mice (B) distributed only on a thin layer in bronchus and around blood cells in the sham group. Compared to sham group, the pulmonary TGF-β1 accumulated in bronchus at 2 days postinstillation, and numerous white blood cells (blue) infiltrated. However, the pulmonary TGF-β1 reduced but still obviously accumulated in bronchus at 5 days postinstillation. Images were captured at medium magnification (Scale = 50 μm).
Figure 6
Figure 6
Pathology of bronchial tissue from WT and ACE2 KO mice after PM2.5 treatment. The lung bronchus sections of WT (A) and ACE2 KO mice (B) after PM2.5 instillation were stained with haematoxylin-eosin (H&E). Relative to initiation of sham mice, the white blood cells markedly infiltrated after PM2.5 treatment, especially at 2 days postinstillation. Besides, the bronchus wall was significantly thickened at 2 days postinstillation but the airway epithelial thickening reduced at 5 days postinstillation. Images were captured at medium magnification (Scale = 50 μm).
Figure 7
Figure 7
Pathology of alveolar tissue from WT and ACE2 KO mice after PM2.5 treatment. The lung alveolar sections of WT (A) and ACE2 KO mice (B) after PM2.5 treatment were stained with haematoxylin-eosin (H&E). Relative to initiation of sham mice, the white blood cells markedly infiltrated and airway epithelial was thickening after PM2.5 treatment. Besides, the ruptured alveoli were revealed at 5 days postinstillation. Images were captured at medium magnification (Scale = 100 μm).
Figure 8
Figure 8
Change in ACE and ACE2 expressions in the lungs of mice after PM2.5 treatment. The pulmonary ACE and ACE2 expression were determined by western blot. β-actin was used as the internal control for ACE and ACE2. The value of ACE and ACE2 expression in non-PM2.5 treatment was calculated in 100% as the sham value. The relative changes of pulmonary ACE expression in WT and ACE2 KO mice at 2 and 5 days postinstillation (A). The relative changes of pulmonary ACE2 expression in ACE2 KO mice at 2 and 5 days postinstillation (B). All values are expressed as the mean ± SD from each group; * p < 0.05 and ** p < 0.01 compared with the Sham value in the same group; † p < 0.05, †† p < 0.01 and ††† p < 0.001 compared with 5 days to 2 days postinstillation in same group; # p < 0.05 compared with the ACE2 KO mice to WT mice in the same day.
Figure 9
Figure 9
Change and distribution of gelatinase activity in the bronchus of WT and ACE2 KO mice after PM2.5 treatment. The location and gelatinase activity in the lungs of WT (A) and ACE2 KO mice (B) were detected by in situ zymography. The gelatin substrate was digested by MMPs and was shown in green, the nuclear signal was stained and was shown in red. Gelatinase activity around the bronchus was significantly increased after PM2.5 treatment. Images were captured at medium magnification (Scale = 50 μm).
Figure 10
Figure 10
Relative MMP-2 and MMP-9 activities in the lungs of mice after PM2.5 treatment. WT and ACE2 KO mice treated with PM2.5 or saline by intratracheal administration for consecutive 3 days and sacrificed at 2 and 5 days postinstillation. The pulmonary MMP-2 and MMP-9 activity was determined by gelatin zymography. The value of MMP-2 and MMP-9 activity in non-PM2.5 treatment was calculated in 100% as the sham value. The pulmonary MMP-2 activity (A) increased in the lungs of WT and ACE2 KO mice after PM2.5 treatment. The MMP-9 activity (B) increased in the lungs of WT and ACE2 KO mice at 2 days postinstillation but only remained at higher level in those of ACE2 KO mice at 5 days postinstillation. All values are expressed as the mean ± SD from each group; * p < 0.05 and ** p < 0.01 compared with the sham value in the same group; † p < 0.05 compared with 5 days to 2 days postinstillation in same group; # p < 0.05 and ## p < 0.01 compared with the ACE2 KO mice to WT mice in the same day.
Figure 11
Figure 11
Elevation of p-ERK1/2 and p-STAT3 levels after PM2.5 treatment. WT and ACE2 KO mice treated PM2.5 or saline by intratracheal administration for consecutive 3 days and sacrificed at 2 and 5 days postinstillation. The expression of p-ERK1/2 and p-STAT3 in the lungs was determined by western blot (A). ERK1/2 and STAT3 were used as the internal controls for p-ERK1/2 and p-STAT3, respectively. The expression of p-ERK1/2 and p-STAT3 in the non-PM2.5 treatment mice were calculated in 100% as the sham. The relative pulmonary p-ERK1/2 (B) and p-STAT3 (C) expression increased in both WT and ACE2 KO mice at 2 days postinstillation, but p-ERK1/2 (B) and p-STAT3 (C) only returned to normal level in WT mice at 5 days postinstillation. All values are expressed as the mean ± SD from each group; * p < 0.05 and ** p < 0.01 compared with the Sham value in the same group; † p < 0.05 and †† p < 0.01 compared with the 5 days to 2 days postinstillation in same group.

References

    1. Pun VC, Kazemiparkouhi F, Manjourides J. et al. Long-term PM2.5 exposures and respiratory, cancer and cardiovascular mortality in American older adults. Am J Epidemiol. 2017;186:961–969. - PMC - PubMed
    1. Song C, He J, Wu L. et al. Health burden attributable to ambient PM2.5 in China. Environ Pollut. 2017;223:575–586. - PubMed
    1. Churg A, Brauer M. Human lung parenchyma retains PM2.5. Am J Respir Crit Care Med. 1997;155:2109–2111. - PubMed
    1. Li YY, Lin T, Wang FW. et al. Seasonal variation of polybrominated diphenyl ethers in PM 2.5 aerosols over the East China Sea. Chemosphere. 2015;119:675–681. - PubMed
    1. Zhang Y, Ji X, Ku T. et al. Heavy metals bound to fine particulate matter from northern China induce season-dependent health risks: A study based on myocardial toxicity. Environ Pollut. 2016;216:380–390. - PubMed

Publication types

MeSH terms