

Identification of key genes and pathways in human clear cell renal cell carcinoma (ccRCC) by co-expression analysis
- PMID: 29559845
- PMCID: PMC5859473
- DOI: 10.7150/ijbs.23574
Identification of key genes and pathways in human clear cell renal cell carcinoma (ccRCC) by co-expression analysis
Abstract
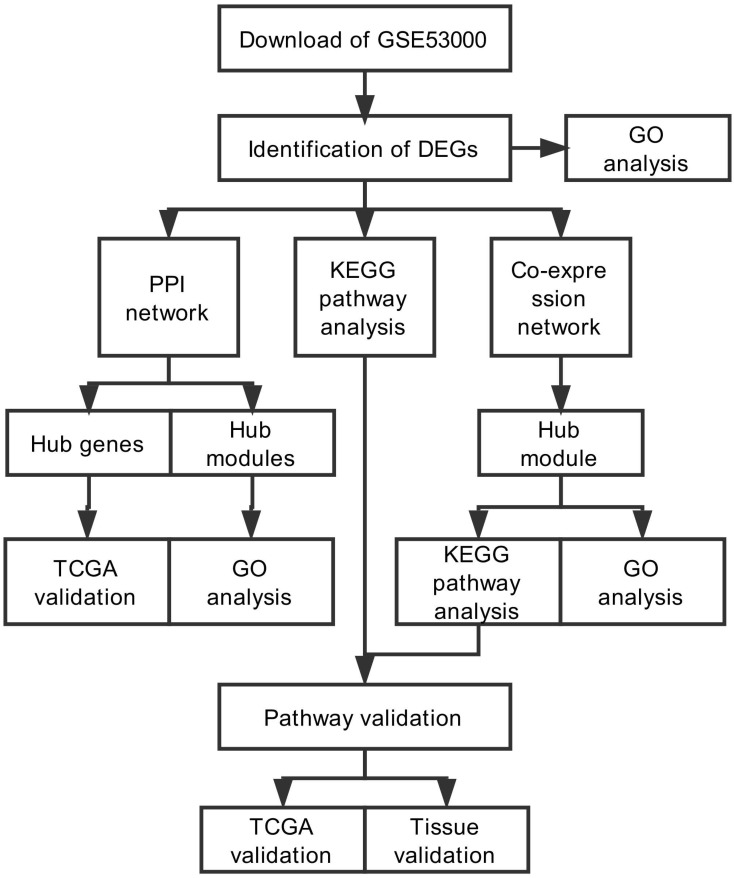
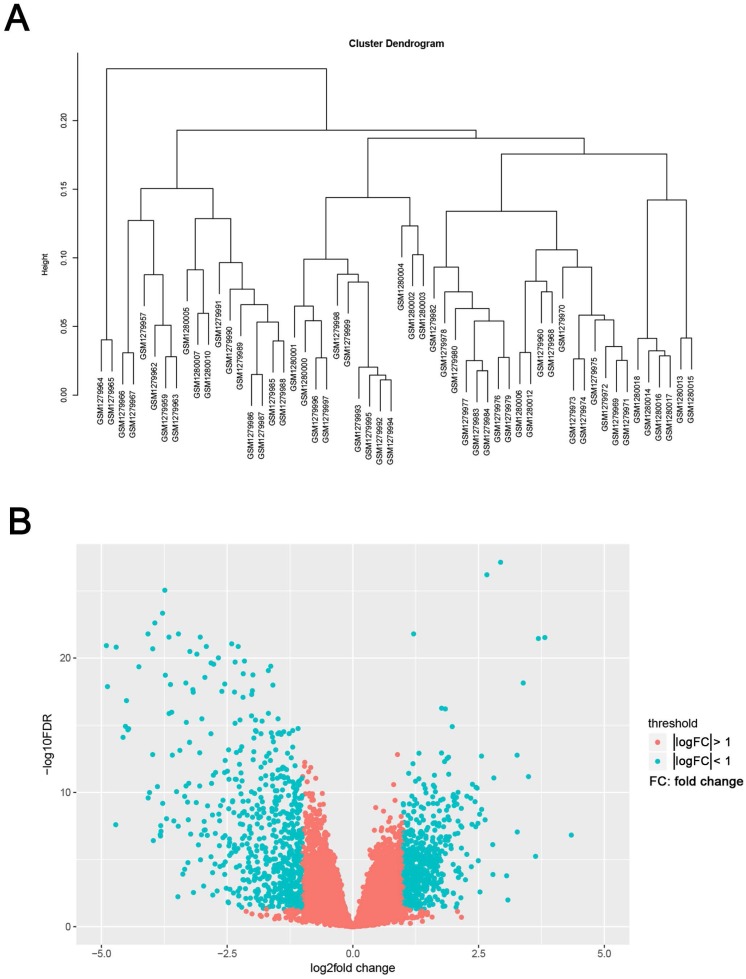
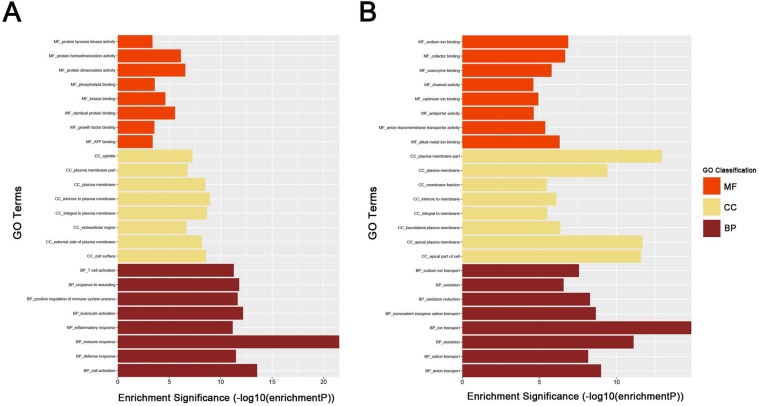
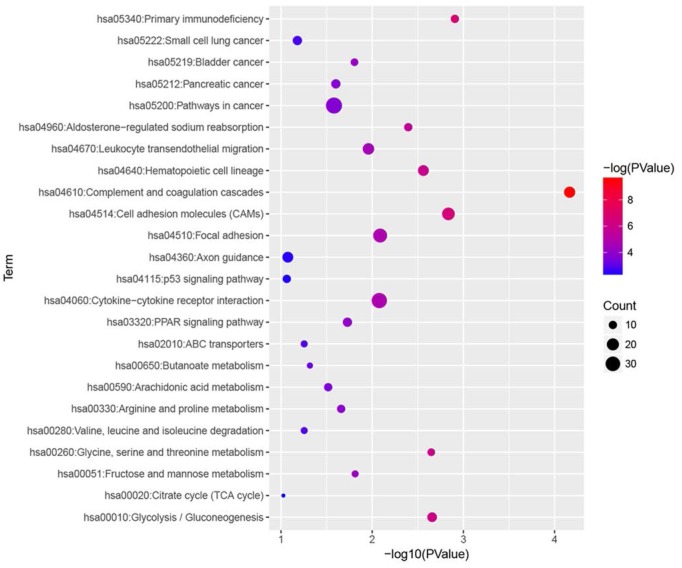
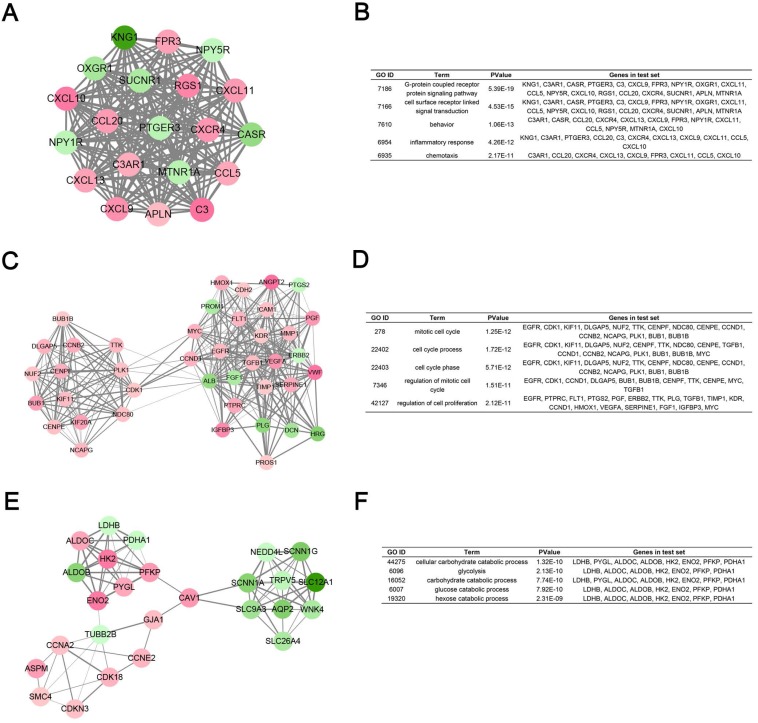
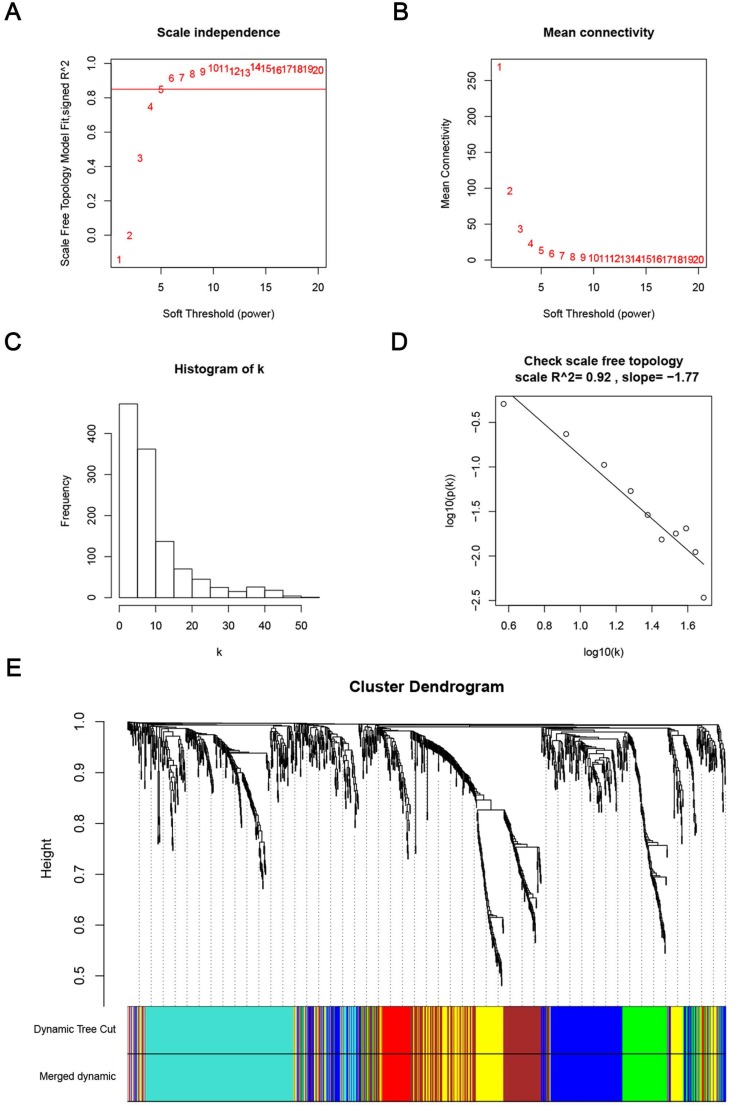
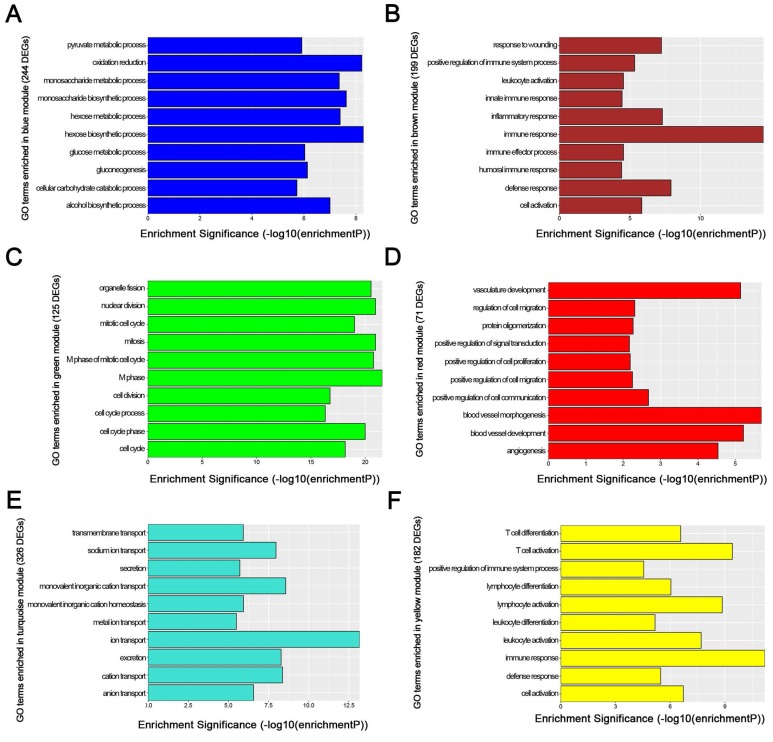
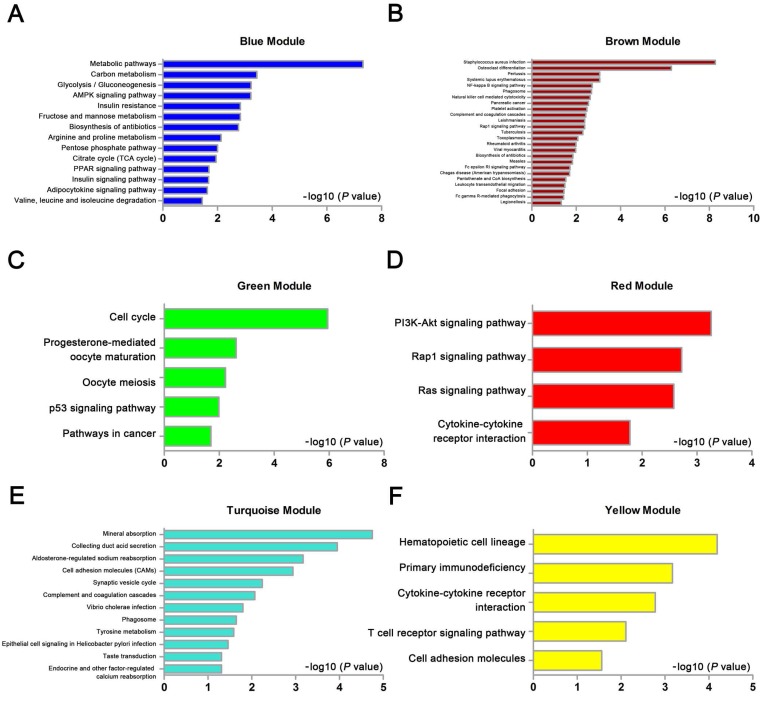
Human clear cell renal cell carcinoma (ccRCC) is the most common solid lesion within kidney, and its prognostic is influenced by the progression covering a complex network of gene interactions. In our study, we screened differential expressed genes, and constructed protein-protein interaction (PPI) network and a weighted gene co-expression network to identify key genes and pathways associated with the progression of ccRCC (n = 56). Functional and pathway enrichment analysis demonstrated that upregulated differentially expressed genes (DEGs) were significantly enriched in response to wounding, positive regulation of immune system process, leukocyte activation, immune response and cell activation. Downregulated DEGs were significantly enriched in oxidation reduction, monovalent inorganic cation transport, ion transport, excretion and anion transport. In the PPI network, top 10 hub genes were identified (TOP2A, MYC, ALB, CDK1, VEGFA, MMP9, PTPRC, CASR, EGFR and PTGS2). In co-expression network, 6 ccRCC-related modules were identified. They were associated with immune response, metabolic process, cell cycle regulation, angiogenesis and ion transport. In conclusion, our study illustrated the hub genes and pathways involved in the progress of ccRCC, and further molecular biological experiments are needed to confirm the function of the candidate biomarkers in human ccRCC.
Keywords: biomarker; clear cell renal cell carcinoma (ccRCC); differentially expressed genes (DEGs); protein-protein interaction (PPI); weighted gene co-expression network analysis (WGCNA).
Conflict of interest statement
Competing Interests: The authors have declared that no competing interest exists.
Figures
References
-
- Siegel RL, Miller KD, Jemal A. Cancer Statistics, 2017. CA Cancer J Clin. 2017;67:7–30. - PubMed
-
- Vera-Badillo FE, Templeton AJ, Duran I. et al. Systemic therapy for non-clear cell renal cell carcinomas: a systematic review and meta-analysis. Eur Urol. 2015;67:740–9. - PubMed
-
- Dahinden C, Ingold B, Wild P. et al. Mining tissue microarray data to uncover combinations of biomarker expression patterns that improve intermediate staging and grading of clear cell renal cell cancer. Clin Cancer Res. 2010;16:88–98. - PubMed
Publication types
MeSH terms
Substances
LinkOut - more resources
Full Text Sources
Other Literature Sources
Medical
Research Materials
Miscellaneous
