

Bmi1 Deficient Mice Exhibit Male Infertility
- PMID: 29559852
- PMCID: PMC5859480
- DOI: 10.7150/ijbs.23325
Bmi1 Deficient Mice Exhibit Male Infertility
Abstract
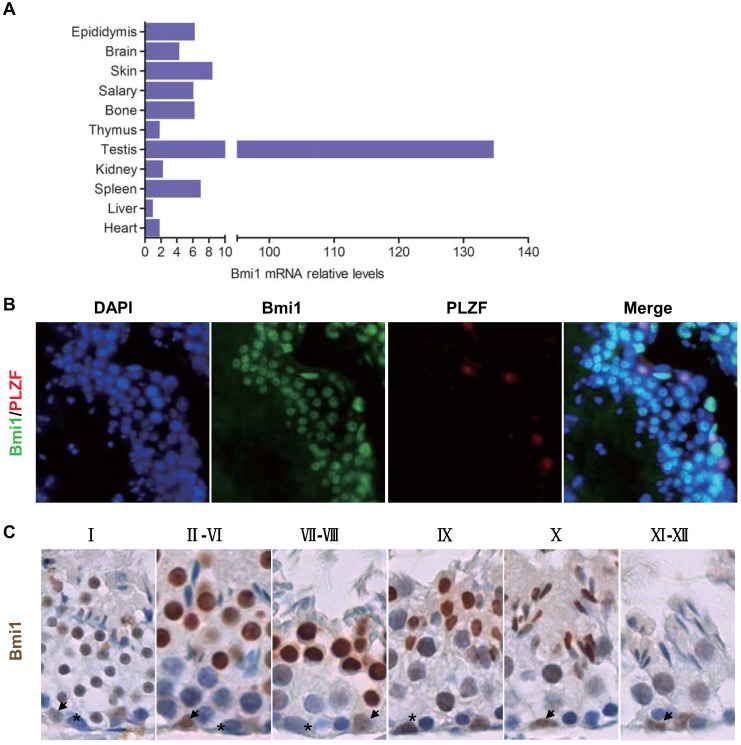
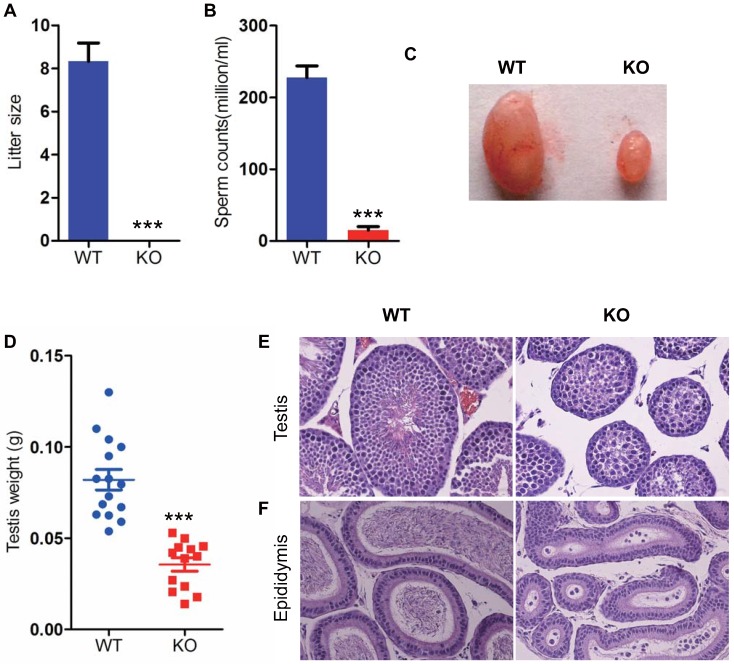
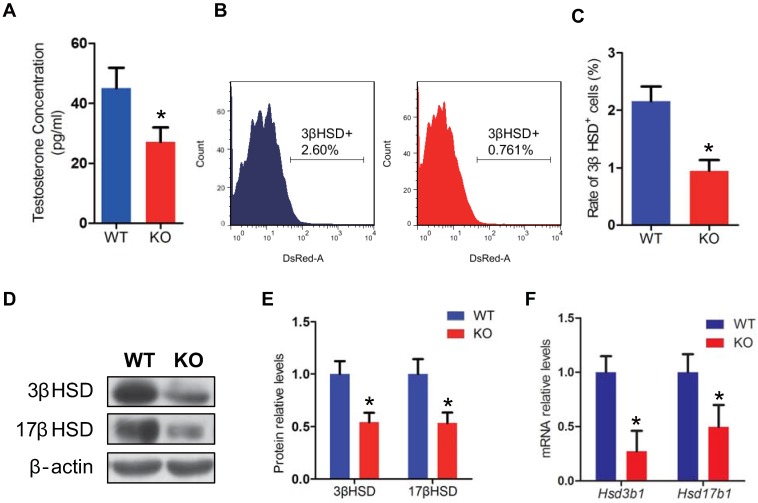
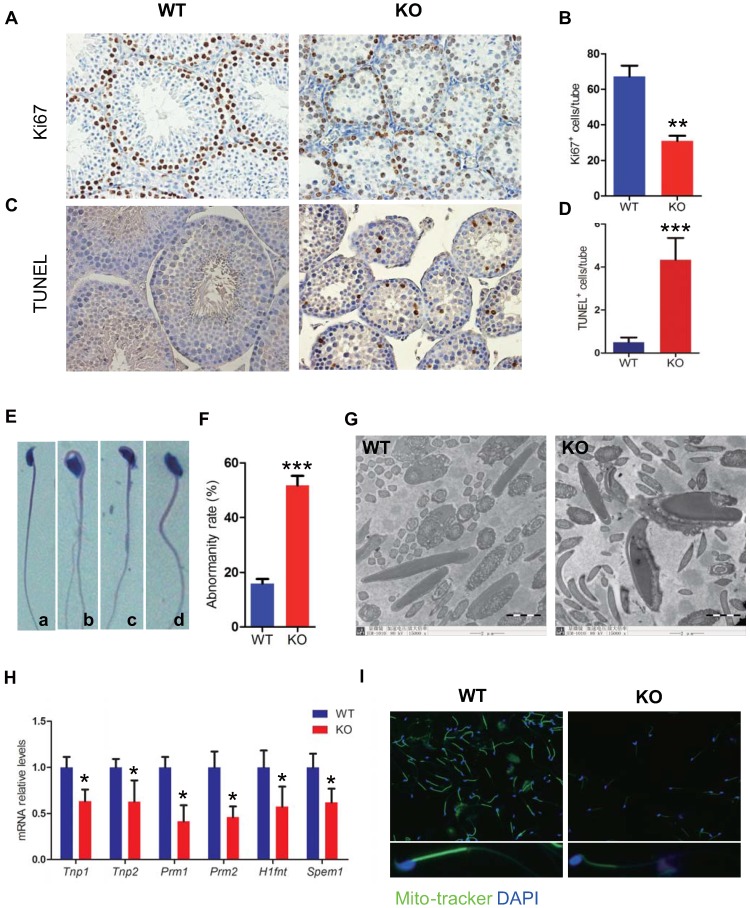
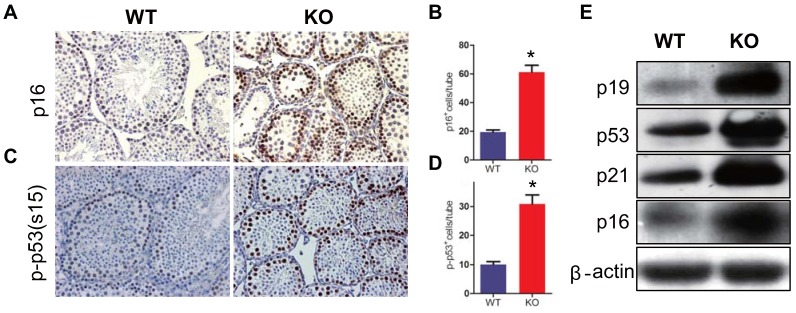
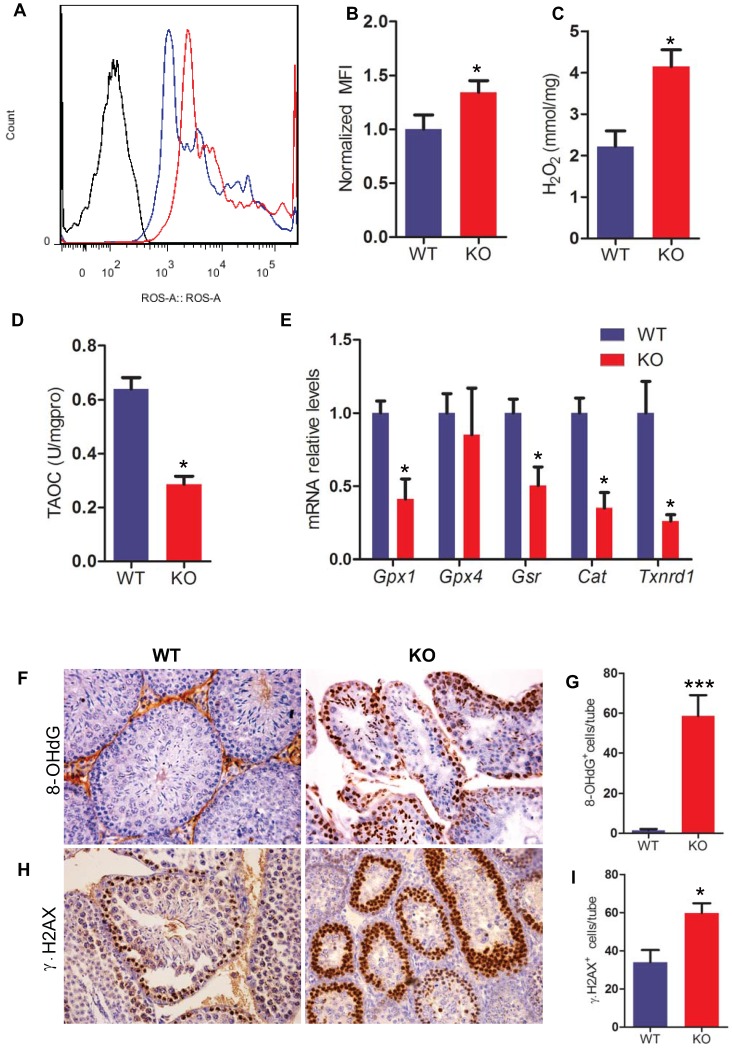
Previous studies have demonstrated that the polycomb repressor Bmi1 is universally expressed in all types of testicular cells and might regulate the spermatogonia proliferation, however, it is unclear whether Bmi1 plays a critical role in maintaining normal male fertility in vivo. To answer this question, we first confirmed that Bmi1 is universally expressed in all types of testicular cells and found that the gene relative expression levels of Bmi1 in testis were the highest relative to other organs. Then we investigated the role of Bmi1 in maintaining normal male fertility using Bmi1 knockout male mouse model. Our results demonstrated that Bmi1 deficiency resulted in totally male infertility with smaller testis, severe oligospermia and sperm malformation. Mechanistically, decreased serum testosterone levels with down-regulating 3βHSD and 17βHSD expression levels, reduced germ cell proliferation, increased germ cell apoptosis with up-regulating p16, p19, p53 and p21 expression levels, increased reactive oxygen species (ROS) and H2O2 levels with down-regulating gene expression levels of anti-oxidant enzymes, and increased 8-OHdG and γ.H2AX positive cells in testis were observed in Bmi1 deficient mice compared with wild-type mice. These results indicate that Bmi1 deficiency results in male infertility by reducing testosterone syntheses, increasing oxidative stress and DNA damage, activating p16 and p19 signaling pathway, inhibiting germ cell proliferation and inducing germ cell apoptosis and sperm malformation. Thus, Bmi1 may be a novel and potential target for the clinic treatment of male infertility.
Conflict of interest statement
Competing Interests: The authors have declared that no competing interest exists.
Figures
Similar articles
-
BMI1 promotes steroidogenesis through maintaining redox homeostasis in mouse MLTC-1 and primary Leydig cells.Cell Cycle. 2020 Aug;19(15):1884-1898. doi: 10.1080/15384101.2020.1779471. Epub 2020 Jun 28. Cell Cycle. 2020. PMID: 32594840 Free PMC article.
-
BMI1 Deficiency Results in Female Infertility by Activating p16/p19 Signaling and Increasing Oxidative Stress.Int J Biol Sci. 2019 Mar 1;15(4):870-881. doi: 10.7150/ijbs.30488. eCollection 2019. Int J Biol Sci. 2019. PMID: 30906217 Free PMC article.
-
Bmi1 Overexpression in Mesenchymal Stem Cells Exerts Antiaging and Antiosteoporosis Effects by Inactivating p16/p19 Signaling and Inhibiting Oxidative Stress.Stem Cells. 2019 Sep;37(9):1200-1211. doi: 10.1002/stem.3007. Epub 2019 Jun 19. Stem Cells. 2019. PMID: 30895687 Free PMC article.
-
Role of the polycomb group gene BMI1 in normal and leukemic hematopoietic stem and progenitor cells.Curr Opin Hematol. 2010 Jul;17(4):294-9. doi: 10.1097/MOH.0b013e328338c439. Curr Opin Hematol. 2010. PMID: 20308890 Review.
-
The role of the Fas/FasL signaling pathway in environmental toxicant-induced testicular cell apoptosis: An update.Syst Biol Reprod Med. 2018 Apr;64(2):93-102. doi: 10.1080/19396368.2017.1422046. Epub 2018 Jan 4. Syst Biol Reprod Med. 2018. PMID: 29299971 Review.
Cited by
-
Histone H3 methylation orchestrates transcriptional program in mouse spermatogenic cell line.J Reprod Dev. 2020 Jun 12;66(3):223-230. doi: 10.1262/jrd.2019-139. Epub 2020 Feb 11. J Reprod Dev. 2020. PMID: 32051348 Free PMC article.
-
The Biology and Regulation of Spermatogonial Stem Cells in the Niche.Adv Exp Med Biol. 2025;1469:333-354. doi: 10.1007/978-3-031-82990-1_14. Adv Exp Med Biol. 2025. PMID: 40301263 Review.
-
BMI1 promotes steroidogenesis through maintaining redox homeostasis in mouse MLTC-1 and primary Leydig cells.Cell Cycle. 2020 Aug;19(15):1884-1898. doi: 10.1080/15384101.2020.1779471. Epub 2020 Jun 28. Cell Cycle. 2020. PMID: 32594840 Free PMC article.
-
Activation of C-C motif chemokine receptor 2 modulates testicular macrophages number, steroidogenesis, and spermatogenesis progression.Cell Tissue Res. 2021 Oct;386(1):173-190. doi: 10.1007/s00441-021-03504-w. Epub 2021 Jul 23. Cell Tissue Res. 2021. PMID: 34296344
-
DNA damage to β cells in culture recapitulates features of senescent β cells that accumulate in type 1 diabetes.Mol Metab. 2022 Aug;62:101524. doi: 10.1016/j.molmet.2022.101524. Epub 2022 Jun 2. Mol Metab. 2022. PMID: 35660116 Free PMC article.
References
-
- Sciarra J. Infertility: an international health problem. Int J Gynaecol Obstet. 1994;46:155–63. - PubMed
-
- Kanatsu-Shinohara M, Shinohara T. Spermatogonial stem cell self-renewal and development. Annu Rev Cell Dev Biol. 2013;29:163–87. - PubMed
-
- O'Hara L, Smith LB. Androgen receptor roles in spermatogenesis and infertility. Best Pract Res Clin Endocrinol Metab. 2015;29:595–605. - PubMed
Publication types
MeSH terms
Substances
LinkOut - more resources
Full Text Sources
Other Literature Sources
Medical
Molecular Biology Databases
Research Materials
Miscellaneous
