

Mechanical Strain Alters Cellular and Nuclear Dynamics at Early Stages of Oligodendrocyte Differentiation
- PMID: 29559894
- PMCID: PMC5845683
- DOI: 10.3389/fncel.2018.00059
Mechanical Strain Alters Cellular and Nuclear Dynamics at Early Stages of Oligodendrocyte Differentiation
Abstract
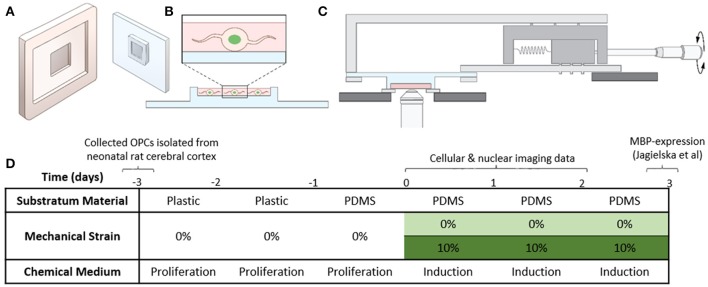
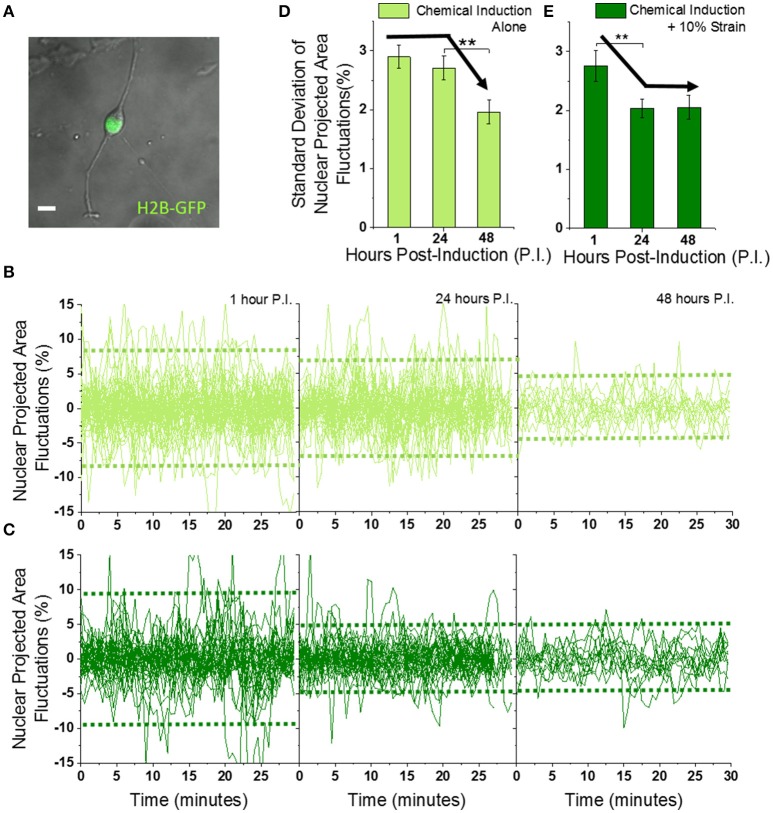
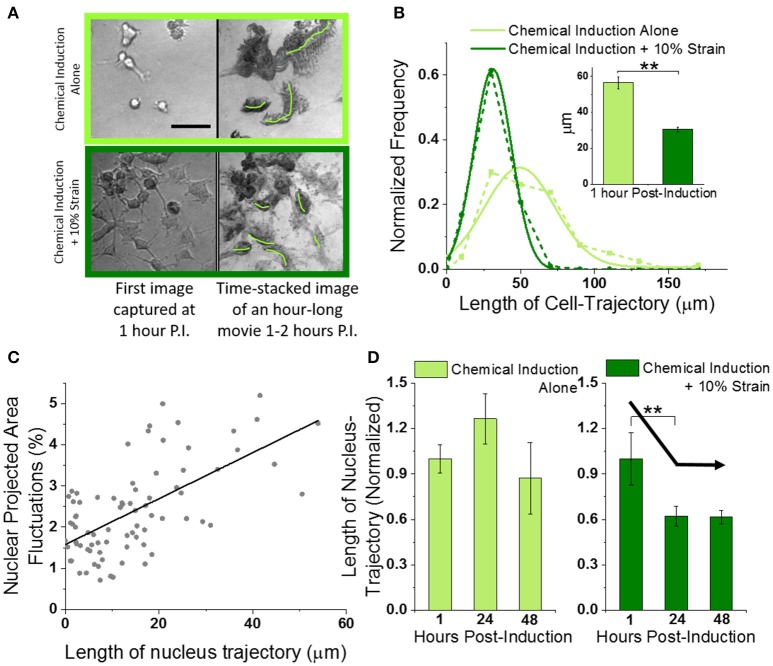
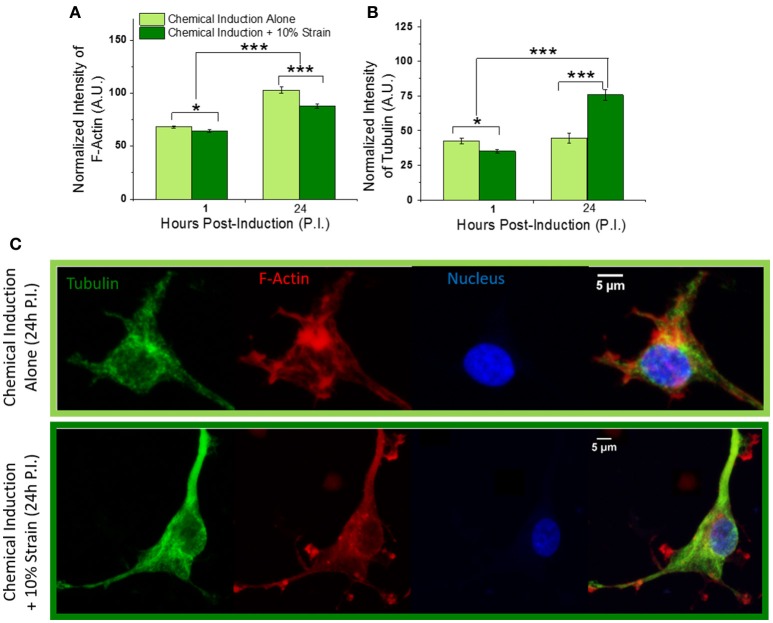
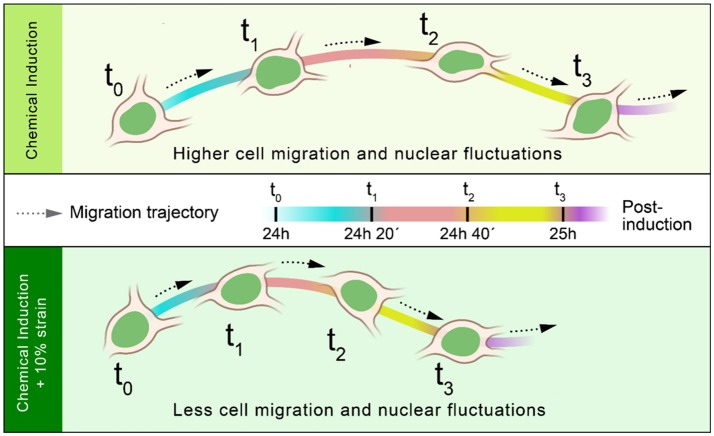
Mechanical and physical stimuli including material stiffness and topography or applied mechanical strain have been demonstrated to modulate differentiation of glial progenitor and neural stem cells. Recent studies probing such mechanotransduction in oligodendrocytes have focused chiefly on the biomolecular components. However, the cell-level biophysical changes associated with such responses remain largely unknown. Here, we explored mechanotransduction in oligodendrocyte progenitor cells (OPCs) during the first 48 h of differentiation induction by quantifying the biophysical state in terms of nuclear dynamics, cytoskeleton organization, and cell migration. We compared these mechanophenotypic changes in OPCs exposed to both chemical cues (differentiation factors) and mechanical cues (static tensile strain of 10%) with those exposed to only those chemical cues. We observed that mechanical strain significantly hastened the dampening of nuclear fluctuations and decreased OPC migration, consistent with the progression of differentiation. Those biophysical changes were accompanied by increased production of the intracellular microtubule network. These observations provide insights into mechanisms by which mechanical strain of physiological magnitude could promote differentiation of progenitor cells to oligodendrocytes via inducing intracellular biophysical responses over hours to days post induction.
Keywords: cell migration; microtubules; nuclear dynamics; oligodendrocyte differentiation; strain.
Figures
Similar articles
-
Mechano-modulation of nuclear events regulating oligodendrocyte progenitor gene expression.Glia. 2019 Jul;67(7):1229-1239. doi: 10.1002/glia.23595. Epub 2019 Feb 8. Glia. 2019. PMID: 30734358 Free PMC article. Review.
-
Mechanical Strain Promotes Oligodendrocyte Differentiation by Global Changes of Gene Expression.Front Cell Neurosci. 2017 Apr 20;11:93. doi: 10.3389/fncel.2017.00093. eCollection 2017. Front Cell Neurosci. 2017. PMID: 28473753 Free PMC article.
-
Mechanostimulation Promotes Nuclear and Epigenetic Changes in Oligodendrocytes.J Neurosci. 2016 Jan 20;36(3):806-13. doi: 10.1523/JNEUROSCI.2873-15.2016. J Neurosci. 2016. PMID: 26791211 Free PMC article.
-
Unbiased stereological analysis of the fate of oligodendrocyte progenitor cells in the adult mouse brain and effect of reference memory training.Behav Brain Res. 2017 Jun 30;329:127-139. doi: 10.1016/j.bbr.2017.04.027. Epub 2017 Apr 23. Behav Brain Res. 2017. PMID: 28442356
-
Modulation of Oligodendrocyte Differentiation by Mechanotransduction.Front Cell Neurosci. 2016 Nov 29;10:277. doi: 10.3389/fncel.2016.00277. eCollection 2016. Front Cell Neurosci. 2016. PMID: 27965541 Free PMC article. Review.
Cited by
-
Mechanosensitivity of Human Oligodendrocytes.Front Cell Neurosci. 2020 Jul 24;14:222. doi: 10.3389/fncel.2020.00222. eCollection 2020. Front Cell Neurosci. 2020. PMID: 32848617 Free PMC article.
-
Engineered cell culture microenvironments for mechanobiology studies of brain neural cells.Front Bioeng Biotechnol. 2022 Dec 14;10:1096054. doi: 10.3389/fbioe.2022.1096054. eCollection 2022. Front Bioeng Biotechnol. 2022. PMID: 36588937 Free PMC article. Review.
-
Mechano-modulation of nuclear events regulating oligodendrocyte progenitor gene expression.Glia. 2019 Jul;67(7):1229-1239. doi: 10.1002/glia.23595. Epub 2019 Feb 8. Glia. 2019. PMID: 30734358 Free PMC article. Review.
-
Mechanical regulation of oligodendrocyte biology.Neurosci Lett. 2020 Jan 19;717:134673. doi: 10.1016/j.neulet.2019.134673. Epub 2019 Dec 12. Neurosci Lett. 2020. PMID: 31838017 Free PMC article. Review.
-
The mechanics of the retina: Müller glia role on retinal extracellular matrix and modelling.Front Med (Lausanne). 2024 Sep 4;11:1393057. doi: 10.3389/fmed.2024.1393057. eCollection 2024. Front Med (Lausanne). 2024. PMID: 39296899 Free PMC article. Review.
References
LinkOut - more resources
Full Text Sources
Other Literature Sources