. 2018 Mar 6:12:36.
doi: 10.3389/fnbeh.2018.00036. eCollection 2018.

An Accumulation-of-Evidence Task Using Visual Pulses for Mice Navigating in Virtual Reality

Affiliations

An Accumulation-of-Evidence Task Using Visual Pulses for Mice Navigating in Virtual Reality

Lucas Pinto et al. Front Behav Neurosci. .

Erratum in

Abstract

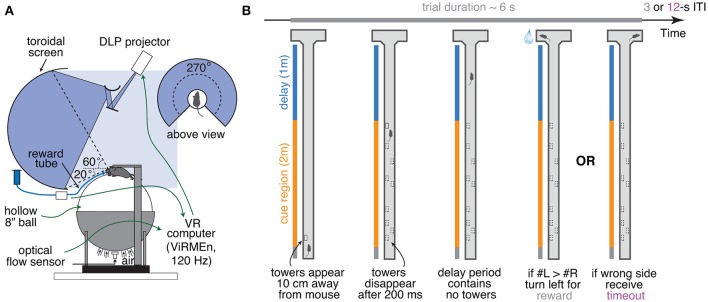
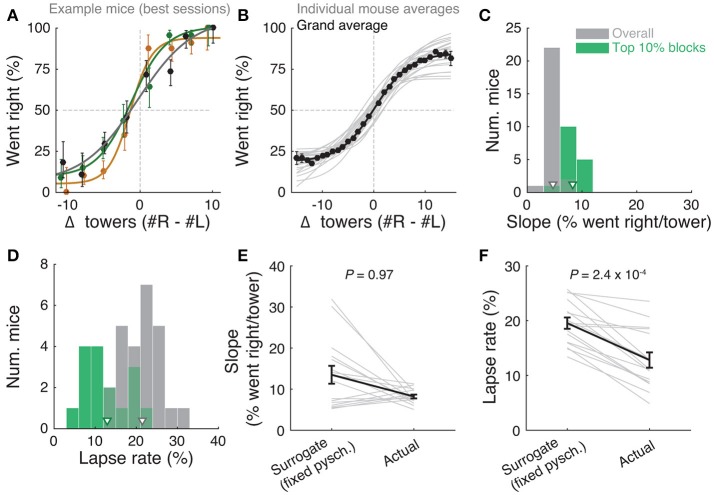
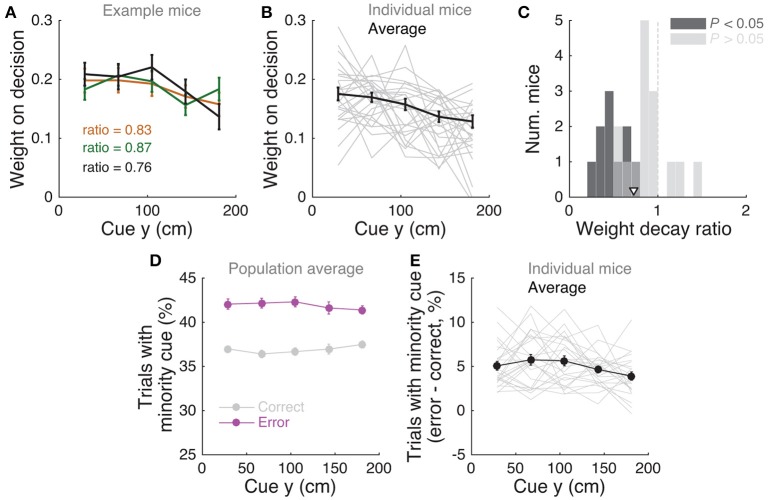
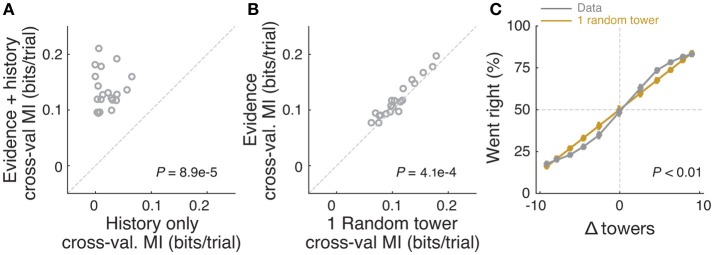
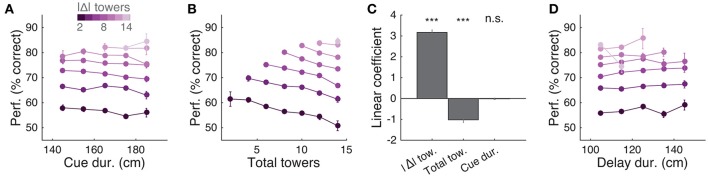
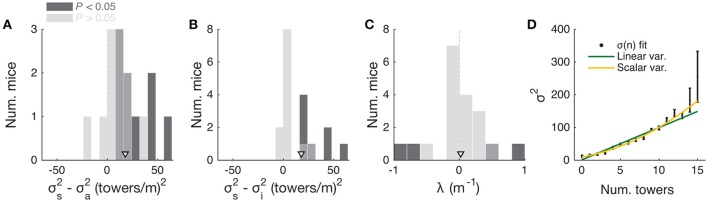
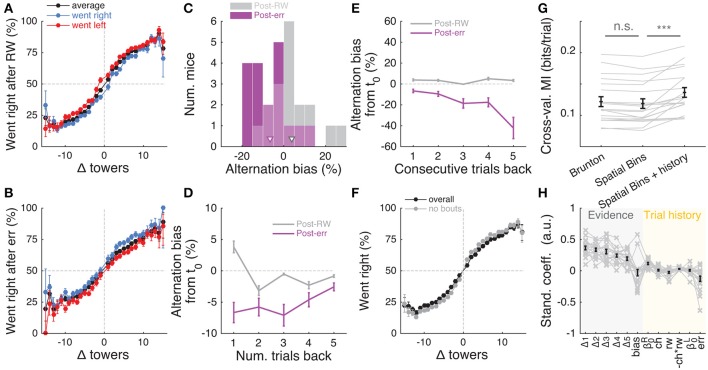
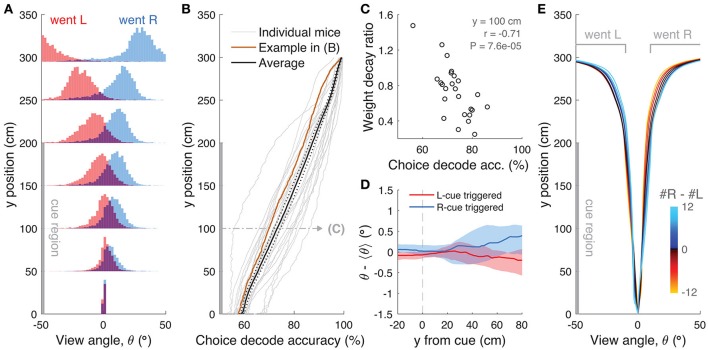
The gradual accumulation of sensory evidence is a crucial component of perceptual decision making, but its neural mechanisms are still poorly understood. Given the wide availability of genetic and optical tools for mice, they can be useful model organisms for the study of these phenomena; however, behavioral tools are largely lacking. Here, we describe a new evidence-accumulation task for head-fixed mice navigating in a virtual reality (VR) environment. As they navigate down the stem of a virtual T-maze, they see brief pulses of visual evidence on either side, and retrieve a reward on the arm with the highest number of pulses. The pulses occur randomly with Poisson statistics, yielding a diverse yet well-controlled stimulus set, making the data conducive to a variety of computational approaches. A large number of mice of different genotypes were able to learn and consistently perform the task, at levels similar to rats in analogous tasks. They are sensitive to side differences of a single pulse, and their memory of the cues is stable over time. Moreover, using non-parametric as well as modeling approaches, we show that the mice indeed accumulate evidence: they use multiple pulses of evidence from throughout the cue region of the maze to make their decision, albeit with a small overweighting of earlier cues, and their performance is affected by the magnitude but not the duration of evidence. Additionally, analysis of the mice's running patterns revealed that trajectories are fairly stereotyped yet modulated by the amount of sensory evidence, suggesting that the navigational component of this task may provide a continuous readout correlated to the underlying cognitive variables. Our task, which can be readily integrated with state-of-the-art techniques, is thus a valuable tool to study the circuit mechanisms and dynamics underlying perceptual decision making, particularly under more complex behavioral contexts.

Keywords: behavior; decision making; evidence accumulation; mouse; spatial navigation; virtual reality.


Figures

Figure 1
Figure 1
Accumulating-towers task. (A) Schematic drawing of the VR setup used to train mice in the task. (B) Schematic drawing of the task showing the progression of an example left-rewarded trial.
Figure 2
Figure 2
Performance of the accumulating-towers task. (A) Best-session example psychometric functions from three mice. Circles: data points, lines: sigmoidal function fits, error bars: binomial confidence intervals. (B) Overall psychometric functions across the population. Thin gray lines: sigmoidal function fits for all mice with at least 1,000 trials (n = 25). Black circles and line: psychometric function with sigmoidal fit for aggregate data (metamouse, n = 135,824 trials). Error bars: binomial confidence intervals. (C) Distribution of slope of the psychometric function for the individual mice shown in (B), pooling all data (gray) or selecting the top 10% of blocks for each animal (with at least 300 remaining trials after this selection, n = 16), as defined by average performance. Arrowheads: mean. (D) Distribution of lapse rates for the mice shown in B, defined as the average error rate for trials where |#R – #L| ≥10. Conventions as in (C). (E) Comparison between psychometric slopes obtained for the top 10% of blocks in a surrogate dataset sampled from a fixed psychometric curve vs. the actual data. Thin gray lines: individual mice, black lines: average, error bars: ± SEM. (F) Comparison of lapse rates between the surrogate and actual data sets. Conventions as in (E).
Figure 3
Figure 3
Mice use cues from the entire cue region. (A) Example logistic regression for three mice. In this analysis, net evidence (#R – #L) in each of five spatial bins is used to predict the mouse's final decision to turn left or right. Notice fairly flat shapes, suggesting that mice take into account evidence from all parts of the cue period. (B) Logistic regression coefficients for all mice with at least 1,000 trials (thin gray lines, n = 25), along with average coefficients across the population (thick black line). Error bars: ± SEM. (C) Distribution of weight decay ratios for the mice shown in B, defined as the average of coefficients in the last two bins divided by the average of the coefficients in the first two bins. Dark gray: mice with significantly non-flat logistic regression weight curves (P < 0.05), light gray: mice with flat curves (P ≥ 0.05). Arrowhead: mean. (D) Average percentage of trials containing at least one minority cue in each binned cue region position for correct (black) and error trials (magenta). Error bars: ± SEM. (E) Difference between the percentage of trials containing at least one minority cue in each binned cue region position between correct and error trials, shown for each individual mouse (thin gray lines), and the average across mice (thick black line). Error bars: ± SEM.
Figure 4
Figure 4
Mice rely on multiple cues to perform the task. (A) Comparison of cross-validated prediction performance of a model containing both trial history and spatially binned evidence (Figure 7H) and one containing only trial history terms (n = 20 mice). MI: model information. (B) Comparison of cross-validated prediction performance of a model in which the mouse makes a decision based on a single random tower and one with spatially binned evidence (no history) (n = 20 mice). (C) Psychometric curves for the actual data and a model that chooses from each trial 1 of the presented cues (randomly) and bases the trial choice on the identity of that cue. Data is aggregated across mice for trials where the total number of cues (#R + #L) is equal to 12. In the scenario where #R + #L is fixed, we expect the “1 random cue” model's performance to be linear with #R – #L (as is borne out in the figure). In contrast, if mice used multiple cues the psychometric curve should be different from a line. The psychometric curve for the actual data (gray) is significantly different from that predicted by the ‘1 random cue’ model (yellow, P < 0.01, shuffle test, see Supplementary Materials and Methods).
Figure 5
Figure 5
Behavioral performance decreases with increasing total number of towers, but not duration of cue period. (A) Overall performance as a function of effective cue period duration in space, for various subsets of trials with different absolute differences between tower counts (|Δ|, color code). Effective duration is defined as the position of the last viewed tower minus the position of the first tower. Error bars: binomial confidence intervals. (B) Overall performance as a function of the total number of towers (#R + #L), for subsets of trials with different |Δ|. Conventions as in (A). (C) Best-fit coefficients from a linear regression model predicting performance as a weighted combination of |Δ| towers, total towers, and effective cue period duration. The data is the mean-subtracted performance averaged across mice. Error bars: standard error for each parameter. Significance was calculated from parameter t-statistics. (D) Overall performance as a function of effective delay period duration in space for subsets of trials with different |Δ|. Error bars: binomial confidence intervals. Conventions as in (A). ***P < 0.001.
Figure 6
Figure 6
Behavioral performance seems to be limited by cue-dependent noise. (A) Distribution across mice (n = 20) of the difference between best-fit sensory and diffusion noise parameters (σ2s and σ2a, respectively) from the Brunton et al. model, color coded according to whether they are significantly different from zero according to 95% confidence intervals determined from cross-validation runs. Arrowhead, population mean. (B) Distribution across mice of the difference between best-fit sensory and initial noise parameters (σ2s and σ2i, respectively) from the Brunton et al. model. Conventions as in (A). (C) Distribution of the memory leak (λ) parameter from the Brunton et al. model. Conventions as in (A). (D) Best-fit parameters for the SDT model (aggregate mouse data). Black data points: parameters from the full model where σ2 is determined separately for each tower count. Yellow line: prediction from the two-parameter scalar variability model. Green line: prediction from the two-parameter linear variance model. Scalar variability yielded significantly better predictions (P < 0.003). Error bars: standard deviation from bootstrapping iterations (n = 200).
Figure 7
Figure 7
Choice is moderately influenced by previous trial history. (A) Psychometric curves for aggregate data (metamouse) divided according to previous choice in rewarded trials. Black: average post-reward curve, blue: psychometric curve for trials following rewarded right choices, red: psychometric curve for trials following rewarded left choices. Error bars: binomial confidence intervals. (B) Psychometric curves divided according to previous choice in error trials. Conventions as in (A). (C) Distribution of alternation bias after reward (gray) or error (magenta) trials. Arrowheads: population mean. (D) Magnitude of alternation bias calculated for 1–5 trials after a choice, separately for rewarded and unrewarded trials. Error bars: ± SEM across mice (n = 18 with at least 1,000 trials after removing trials with fewer than 5 history trials). (E) Magnitude of alternation bias calculated for 1–5 trials after identical rewarded or unrewarded choices. Error bars: ± SEM. (F) Psychometric curves for aggregate data (metamouse) with the trial selection adopted throughout the paper (black) and adopting an additional criterion to exclude at least 3 consecutive-choice trials (gray). Error bars: binomial confidence intervals. (G) Comparison of cross-validated model prediction performance for the Brunton et al. DDM, the spatial-bin logistic regression, and the latter plus trial history terms. Thin gray lines: individual mice, black lines and error bars: mean ± SEM. ***P < 0.001. MI: model information index. (H) Best-fit standardized coefficients for the spatial bins model with trial history terms. Thin gray lines: individual mice, thick black lines: population mean, error bars: ± SEM.
Figure 8
Figure 8
View angle trajectories. (A) Distribution of view angles in left and right choice trials (arbitrary units, normalized to equal area for both choice categories) for an example mouse, sampled at several y positions (0, 50, …, 250, 295 cm) along the stem of the T-maze. (B) Accuracy of decoding the eventual choice of a given mouse using a threshold on the view angle, evaluated at various y positions along the T-maze. (C) Scatter plot across mice of the evidence weight decay ratio (see Figure 3C) vs. the choice decoding accuracy evaluated at halfway into the cue region as indicated in (B). (D) Cue-triggered change in the view angle θ relative to the average trajectory <θ> for trials of the same choice. The bands indicate the 1 standard deviation spread across mice, with the thick lines being the median across mice. (E) Average view angle for subsets of left/right choice trials with various values of #R – #L (color code). For a given choice, the mean view angle trajectory of individual mice are aligned to the aggregate data (metamouse) before averaging.

References

    1. Alyan S., Jander R. (1994). Short-range homing in the house mouse, Mus musculus: stages in the learning of directions. Anim. Behav. 48, 285–298. 10.1006/anbe.1994.1242 - DOI
    1. Aronov D., Tank D. W. (2014). Engagement of neural circuits underlying 2d spatial navigation in a rodent virtual reality system. Neuron 84, 442–456. 10.1016/j.neuron.2014.08.042 - DOI - PMC - PubMed
    1. Bäckman C. M., Malik N., Zhang Y., Shan L., Grinberg A., Hoffer B. J., et al. . (2006). Characterization of a mouse strain expressing Cre recombinase from the 3' untranslated region of the dopamine transporter locus. Genesis 44, 383–390. 10.1002/dvg.20228 - DOI - PubMed
    1. Benjamini Y., Hochberg Y. (1995). Controlling the false discovery rate: a practical and powerful approach to multiple testing. J. R. Stat. Soc. Series B Stat. Methodol. 57, 289–300.
    1. Brody C. D., Hanks T. D. (2016). Neural underpinnings of the evidence accumulator. Curr. Opin. Neurobiol. 37, 149–157. 10.1016/j.conb.2016.01.003 - DOI - PMC - PubMed

LinkOut - more resources