. 2018 Mar 6:10:47.
doi: 10.3389/fnagi.2018.00047. eCollection 2018.

Longitudinal Diffusion Tensor Imaging Resembles Patterns of Pathology Progression in Behavioral Variant Frontotemporal Dementia (bvFTD)

Affiliations

Longitudinal Diffusion Tensor Imaging Resembles Patterns of Pathology Progression in Behavioral Variant Frontotemporal Dementia (bvFTD)

Jan Kassubek et al. Front Aging Neurosci. .

Abstract

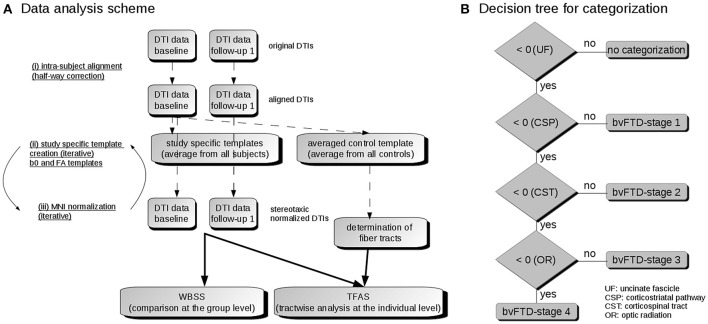
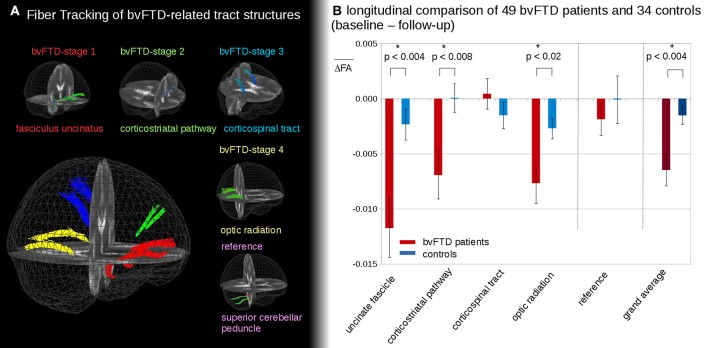
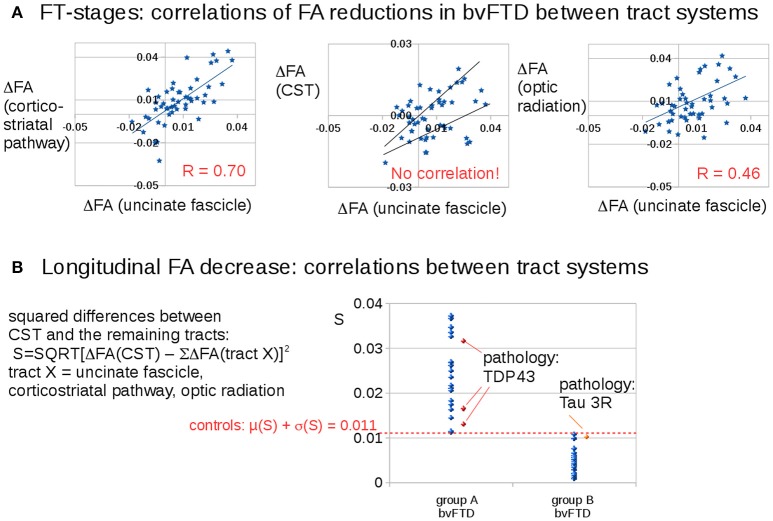
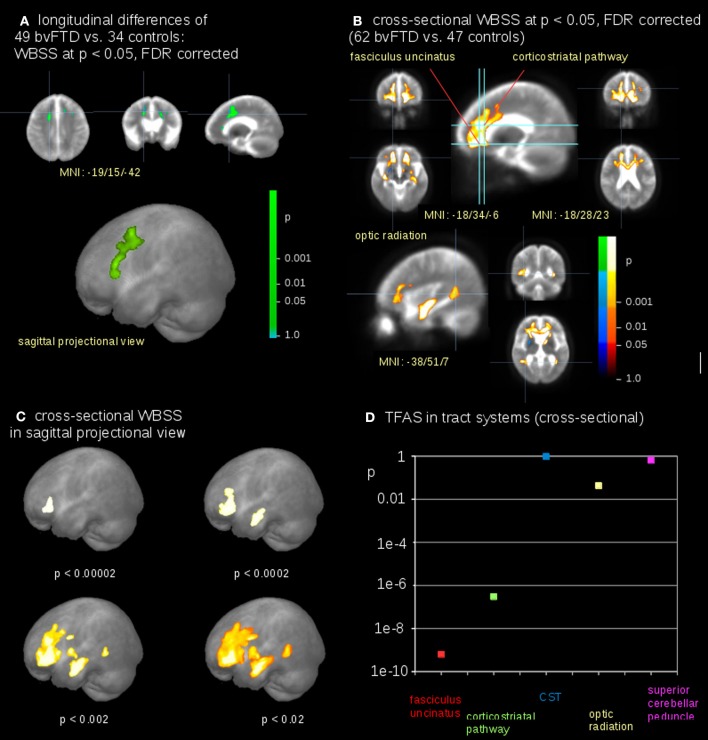
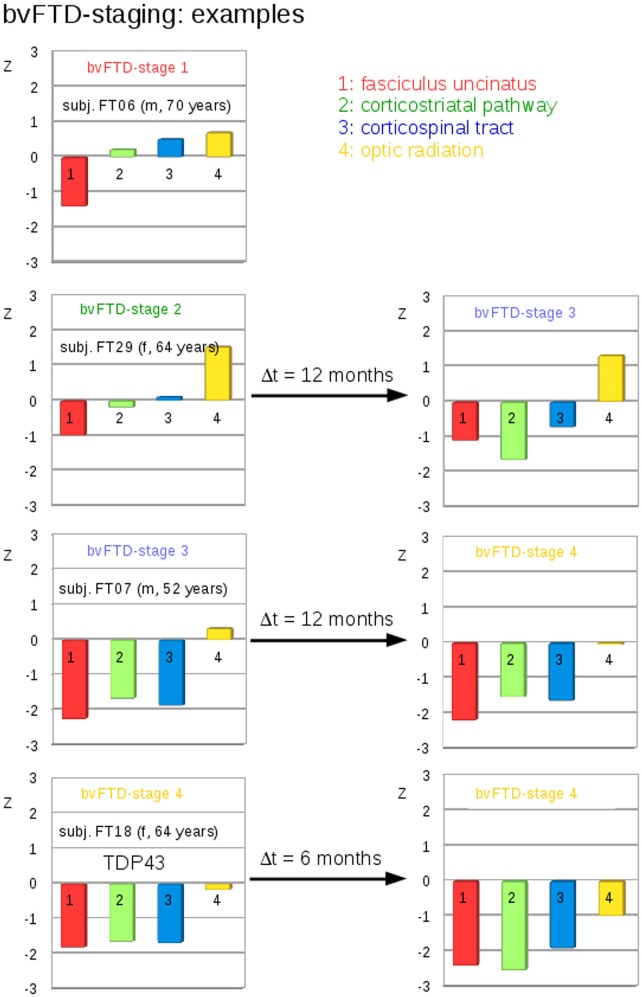
Objective: Recently, the characteristic longitudinal distribution pattern of the underlying phosphorylated TDP-43 (pTDP-43) pathology in the behavioral variant of frontotemporal dementia (bvFTD) excluding Pick's disease (PiD) across specific brain regions was described. The aim of the present study was to investigate whether in vivo investigations of bvFTD patients by use of diffusion tensor imaging (DTI) were consistent with these proposed patterns of progression. Methods: Sixty-two bvFTD patients and 47 controls underwent DTI in a multicenter study design. Of these, 49 bvFTD patients and 34 controls had a follow-up scan after ~12 months. Cross-sectional and longitudinal alterations were assessed by a two-fold analysis, i.e., voxelwise comparison of fractional anisotropy (FA) maps and a tract of interest-based (TOI) approach, which identifies tract structures that could be assigned to brain regions associated with disease progression. Results: Whole brain-based spatial statistics showed white matter alterations predominantly in the frontal lobes cross-sectionally and longitudinally. The TOIs of bvFTD neuroimaging stages 1 and 2 (uncinate fascicle-bvFTD pattern I; corticostriatal pathway-bvFTD pattern II) showed highly significant differences between bvFTD patients and controls. The corticospinal tract-associated TOI (bvFTD pattern III) did not differ between groups, whereas the differences in the optic radiation (bvFTD pattern IV) reached significance. The findings in the corticospinal tract were due to a "dichotomous" behavior of FA changes there. Conclusion: Longitudinal TOI analysis demonstrated a pattern of white matter pathways alterations consistent with patterns of pTDP-43 pathology.

Keywords: diffusion tensor imaging; fractional anisotropy; frontotemporal lobar degeneration; neuropathology; staging.


Figures

Figure 1
Figure 1
(A) Data analysis scheme. (i) To obtain a common coordinate frame, baseline and follow-up DTI data were aligned by half-way correction. (ii) After landmark normalization, study-specific b0 and FA templates were created. (iii) DTI data of all visits were stereotaxically normalized in the Montreal Neurological Institute (MNI) coordinate frame in an iterative process. Then, the voxelwise statistical comparison between the patients and the control group was performed by whole brain based spatial statistics (WBSS). After averaging controls' data sets, fiber tracts were calculated from this averaged data set. Finally, tractwise fractional anisotropy statistics (TFAS) was applied. (B) Decision algorithm for categorization. From all bvFTD patients, those were further analyzed who had z-transformed TOI-FA values < 0, i.e., TOI-FA values below the FA-threshold defined for the uncinate fascicle (bvFTD-stage 1). Of this group, those were defined for bvFTD-stage 1 who had z-transformed TOI-FA-values > 0 in the corticostriatal pathway, and those were defined for bvFTD-stage 2 who had z-transformed TOI-FA-values > 0 in the corticospinal tract. The remaining individuals were categorized into bvFTD-stages 3 or 4, depending on whether their z-transformed TOI-FA-values in the optic radiation were > 0 or < 0.
Figure 2
Figure 2
(A) 3D-images of tracts of interest. 3D-images of tracts of interest: fasciculus uncinatus, corresponding to bvFTD stage 1; corticostriatal pathway, corresponding to bvFTD stage 2; corticospinal tract (CST) corresponding to bvFTD stage 3, optic radiation, corresponding to bvFTD stage 4; superior cerebellar peduncle as reference path. (B) Longitudinal FA differences in stage-related tract systems. Longitudinal averaged FA differences (baseline—follow-up) in tracts at the group level—*significance.
Figure 3
Figure 3
Longitudinal FA decrease in different tract systems: prominent differences for the CST (bvFTD stage 3). (A) Correlations of FA reductions in bvFTD patients between tract systems. (B) Squared differences of FA decrease in the CST compared to averaged FA decreases in the other tract systems. A “dichotomous” behavior was identified: one bvFTD subgroup A (N = 22) with an FA decrease in the CST which is different to the FA decrease in the other stage-related tract structures (S > 0.011) and the other subgroup (group B, N = 29) with an FA decrease in the CST which is similar to the FA decrease in the other stage-related tract structures (S < 0.011). The four available pathology results were indicated in red/orange.
Figure 4
Figure 4
Comparison at the group level—bvFTD-patients vs. controls. (A) Whole brain-based spatial statistics (WBSS) of longitudinal alterations in FA maps of 49 bvFTD-patients vs. 34 controls (at FDR corrected p < 0.05). (B) WBSS of FA maps of 62 bvFTD-patients vs. 47 controls (at FDR corrected p < 0.05). (C) Whole brain-based spatial statistics (WBSS) of FA maps (FDR corrected) in sagittal projectional views for different significances. (D) Significance levels for TFAS of tract systems corresponding to bvFTD-stages: fasciculus uncinatus (bvFTD stage 1), corticostriatal pathway (bvFTD stage 2), corticospinal tract (CST) (bvFTD stage 3), optic radiation (bvFTD stage 4), and as the reference path the superior cerebellar peduncle.
Figure 5
Figure 5
Individual examples for the staging categorization. Individual cross-sectional examples for the categorization of bvFTD patients into bvFTD stages based upon deviations of z-transformed FA-values (TFAS) from controls' values for different bvFTD stages. Left: baseline categorization, Right: categorization at follow-up.

Similar articles

Cited by

References

    1. Agosta F., Scola E., Canu E., Marcone A., Magnani G., Sarro L., et al. . (2012). White matter damage in frontotemporal lobar degeneration spectrum. Cereb. Cortex 22, 2705–2714. 10.1093/cercor/bhr288 - DOI - PubMed
    1. Alexander A. L., Hasan K. M., Lazar M., Tsuruda J. S., Parker D. L. (2001). Analysis of partial volume effects in diffusion-tensor MRI. Magn. Reson. Med. 45, 770–780. 10.1002/mrm.1105 - DOI - PubMed
    1. Braak H., Brettschneider J., Ludolph A. C., Lee V. M., Trojanowski J. Q., Del Tredici K. (2013). Amyotrophic lateral sclerosis–a model of corticofugal axonal spread. Nat. Rev. Neurol. 9, 708–714. 10.1038/nrneurol.2013.221 - DOI - PMC - PubMed
    1. Brett M., Johnsrude I. S., Owen A. M. (2002). The problem of functional localization in the human brain. Nat. Rev. Neurosci. 3, 243–249. 10.1038/nrn756 - DOI - PubMed
    1. Brettschneider J., Del Tredici K., Irwin D. J., Grossman M., Robinson J. L., Toledo J. B., et al. . (2014). Sequential distribution of pTDP-43 pathology in behavioral variant frontotemporal dementia (bvFTD). Acta Neuropathol. 127, 423–439. 10.1007/s00401-013-1238-y - DOI - PMC - PubMed

LinkOut - more resources