. 2018 Mar 6:9:66.
doi: 10.3389/fpsyt.2018.00066. eCollection 2018.

Working Memory Modulates Glutamate Levels in the Dorsolateral Prefrontal Cortex during 1H fMRS

Affiliations

Working Memory Modulates Glutamate Levels in the Dorsolateral Prefrontal Cortex during 1H fMRS

Eric A Woodcock et al. Front Psychiatry. .

Abstract

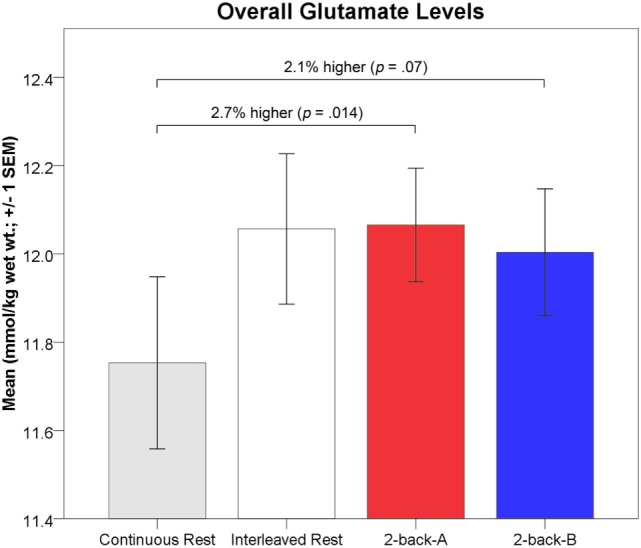
Glutamate is involved in excitatory neurotransmission and metabolic processes related to brain function. Previous studies using proton functional magnetic resonance spectroscopy (1H fMRS) have demonstrated elevated cortical glutamate levels by 2-4% during visual and motor stimulation, relative to periods of no stimulation. Here, we extended this approach to working memory cognitive task performance, which has been consistently associated with dorsolateral prefrontal cortex (dlPFC) activation. Sixteen healthy adult volunteers completed a continuous visual fixation "rest" task followed by a letter 2-back working memory task during 1H fMRS acquisition of the left dlPFC, which encompassed Brodmann areas 45 and 46 over a 4.5-cm3 volume. Using a 100% automated fitting procedure integrated with LCModel, raw spectra were eddy current-, phase-, and shift-corrected prior to quantification resulting in a 32s temporal resolution or 8 averages per spectra. Task compliance was high (95 ± 11% correct) and the mean Cramer-Rao Lower Bound of glutamate was 6.9 ± 0.9%. Relative to continuous passive visual fixation, left dlPFC glutamate levels were significantly higher by 2.7% (0.32 mmol/kg wet weight) during letter 2-back performance. Elevated dlPFC glutamate levels reflect increased metabolic activity and excitatory neurotransmission driven by working memory-related cognitive demands. These results provide the first in vivo demonstration of elevated dlPFC glutamate levels during working memory.

Keywords: dorsolateral prefrontal cortex; excitatory neurotransmission; glutamate; magnetic resonance spectroscopy; metabolism; neuroimaging; working memory.


Figures

Figure 1
Figure 1
A schematic representation of the glutamatergic tripartite synapse is depicted. Black arrows illustrate relationships between molecular species. ACA, acetyl-CoA; αKG, α-ketoglutarate; GLC, glucose; GLN, glutamine; GLU, glutamate; LAC, lactate; OAA, oxaloacetate; PYR, pyruvate.
Figure 2
Figure 2
The experimental tasks are depicted. Left panel: the continuous passive visual fixation task consisted of instructions (“Rest”; 2s) and static fixation cross (centered on-screen; 238s). Right panel: the letter 2-back task consisted of two phases: variance minimization and alternating periods of letter 2-back interleaved with periods of passive visual fixation. The variance minimization phase consisted of a flashing grayscale checkerboard (centered on-screen; 3Hz) presented for 208s. Previous research in our laboratory demonstrated that the flashing checkerboard minimized glutamate variance better than alternative approaches (36). The working memory task consisted of seven interleaved repetitions of passive visual fixation [32s; 2s of instructions (“Rest”), 30s of static fixation cross centered on-screen] and letter 2-back [64s; 4s of instructions (“2-back”), 20 capitalized letters presented serially 3s/letter (60s total); each letter was presented on screen for 500ms followed by 2,500ms of blank screen].
Figure 3
Figure 3
Orthonormal slices of voxel overlap across all subjects are depicted in a template brain. The voxel (15mm × 20mm × 15mm; 4.5cm3) was located in the left dlPFC and included Brodmann areas 45 and 46. 3D geometric voxel overlap is indicated by the red-to-white color gradient (white = complete voxel overlap across all subjects; orange-red = incomplete overlap across subjects). Voxel placement reliability across all subjects was excellent (89.9%).
Figure 4
Figure 4
Letter 2-back behavioral data are depicted. Upper panel: letter 2-back response accuracy (mean percentage correct ± 1 SEM) is depicted across task blocks. Response accuracy significantly improved across task repetitions (Time effect). Lower panel: letter 2-back response latency [mean response latency (ms) ± 1 SEM] is depicted across task blocks.
Figure 5
Figure 5
A representative 1H magnetic resonance spectroscopy spectrum is depicted (32s temporal resolution; 8 averages). The raw signal is depicted in black, while the LCModel fit is in red. The isolated glutamate (GLU) signal (blue line) and residual are presented below the spectrum. Chemical shift (ppm) is depicted below the spectrum. NAA, N-acetyl-aspartate; PCr+Cr phosphocreatine plus creatine; GPC+PC, glycerophosphocholine plus phosphocholine; myo-Ins, myo-Inositol.
Figure 6
Figure 6
Absolute glutamate levels (mmol/kg wet wt. ± 1 SEM) for each task phase are depicted. Mean 2-back-A glutamate levels (red) were significantly higher (2.7%; 0.32 mmol/kg wet wt.) than continuous passive visual fixation glutamate levels (gray). Mean 2-back-B glutamate levels (blue) were non-significantly higher (2.1%; 0.25 mmol/kg wet wt.; p = 0.07) than continuous passive visual fixation glutamate levels (gray). Mean interleaved visual fixation glutamate levels (white) did not differ from 2-back levels.
Figure 7
Figure 7
Glutamate levels (±1 SEM) are depicted across task blocks. Glutamate levels during 2-back-A (red) and 2-back-B (blue) are depicted as a percentage relative to the mean continuous visual fixation levels.
Figure 8
Figure 8
A schematic representation of the glutamatergic tripartite synapse is depicted. Black arrows illustrate relationships between molecular species. Red arrows illustrate enzymatic or metabolic reactions that are hypothesized to be upregulated during neural stimulation or cognitive task performance based on well-controlled preclinical studies which observed an increase in glutamate-glutamine cycling [e.g., Ref. (50)]. Net formation of glutamate during stimulation (i.e., as observed in 1H fMRS studies) is hypothesized to be associated with elevated glucose (GLC) extraction and metabolism (CMRGLC) (50). ACA, acetyl-CoA; αKG, α-ketoglutarate; CMRGLC, cerebral metabolic rate of glucose; GLC, glucose; GLN, glutamine; VGS, glutamine synthetase rate; GLU, glutamate; LAC, lactate; OAA, oxaloacetate; PYR, pyruvate; VPC, pyruvate carboxylation rate; VTCA, TCA cycle rate.

Similar articles

Cited by

References

    1. Erecińska M, Silver IA. Metabolism and role of glutamate in mammalian brain. Prog Neurobiol (1990) 35:245–96.10.1016/0301-0082(90)90013-7 - DOI - PubMed
    1. Rothman DL, De Feyter HM, Graaf RA, Mason GF, Behar KL. 13C MRS studies of neuroenergetics and neurotransmitter cycling in humans. NMR Biomed (2011) 24:943–57.10.1002/nbm.1772 - DOI - PMC - PubMed
    1. Stanley JA, Raz N. Functional magnetic resonance spectroscopy: the “new” MRS for cognitive neuroscience and psychiatry research. Front Psychiatry (2018). - PMC - PubMed
    1. Mangia S, Tkáč I, Gruetter R, Van De Moortele P-F, Giove F, Maraviglia B, et al. Sensitivity of single-voxel 1H-MRS in investigating the metabolism of the activated human visual cortex at 7 T. Magn Reson Imaging (2006) 24:343–8.10.1016/j.mri.2005.12.023 - DOI - PubMed
    1. Mangia S, Tkáč I, Gruetter R, Van De Moortele P-F, Maraviglia B, Uğurbil K. Sustained neuronal activation raises oxidative metabolism to a new steady-state level: evidence from 1H NMR spectroscopy in the human visual cortex. J Cereb Blood Flow Metab (2007) 27:1055–63.10.1038/sj.jcbfm.9600401 - DOI - PubMed

LinkOut - more resources