

Next-Generation Sequencing Analysis of the Human TCRγδ+ T-Cell Repertoire Reveals Shifts in Vγ- and Vδ-Usage in Memory Populations upon Aging
- PMID: 29559980
- PMCID: PMC5845707
- DOI: 10.3389/fimmu.2018.00448
Next-Generation Sequencing Analysis of the Human TCRγδ+ T-Cell Repertoire Reveals Shifts in Vγ- and Vδ-Usage in Memory Populations upon Aging
Abstract
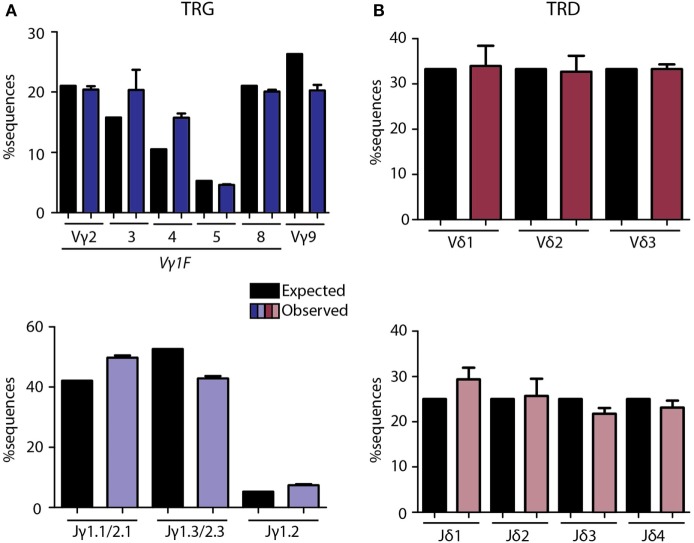
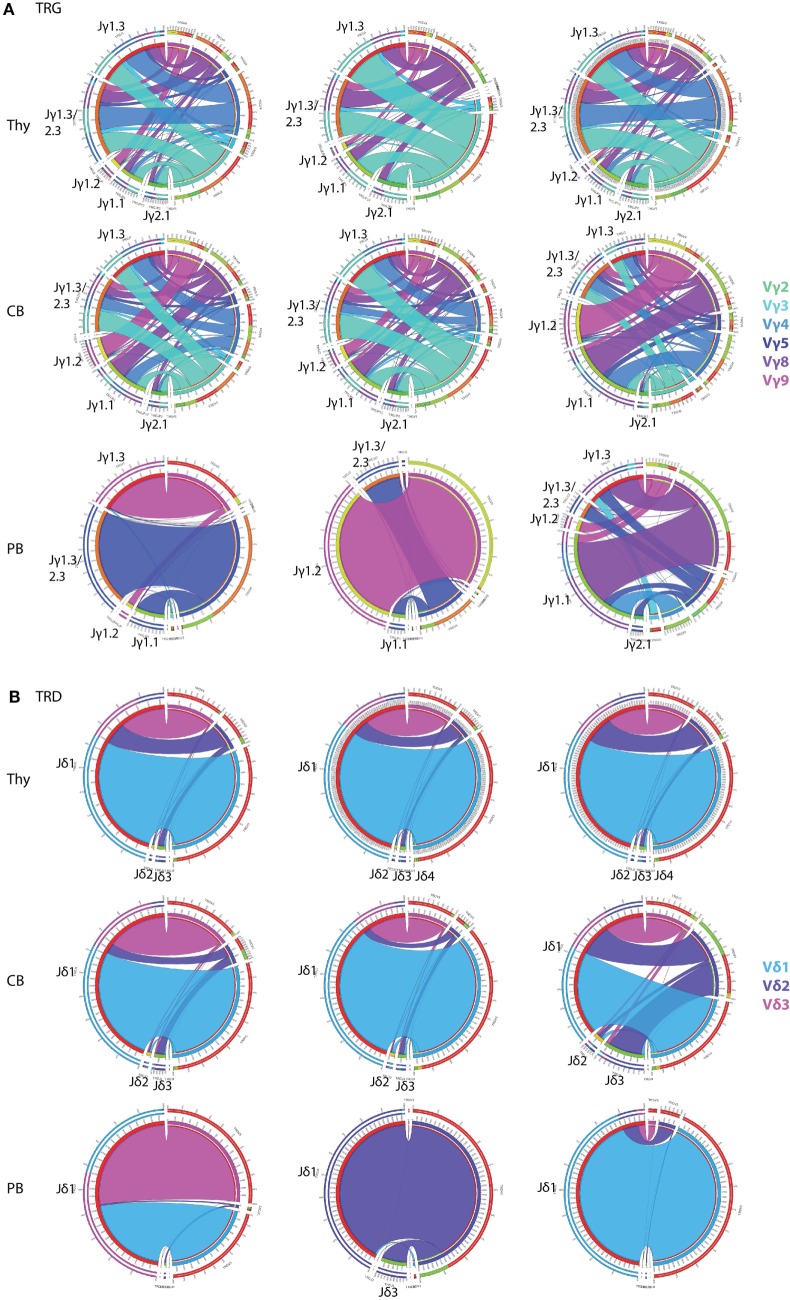
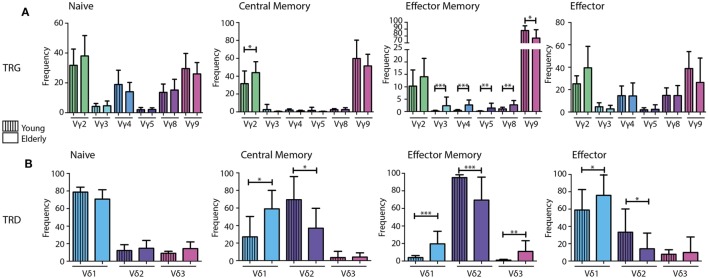
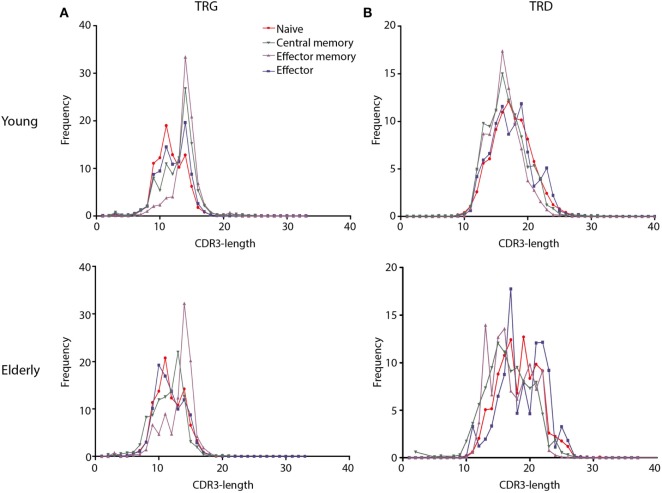
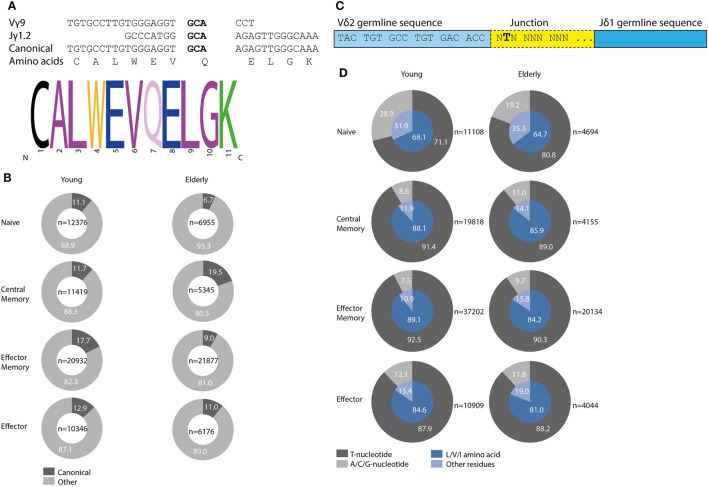
Immunological aging remodels the immune system at several levels. This has been documented in particular for the T-cell receptor (TCR)αβ+ T-cell compartment, showing reduced naive T-cell outputs and an accumulation of terminally differentiated clonally expanding effector T-cells, leading to increased proneness to autoimmunity and cancer development at older age. Even though TCRαβ+ and TCRγδ+ T-cells follow similar paths of development involving V(D)J-recombination of TCR genes in the thymus, TCRγδ+ T-cells tend to be more subjected to peripheral rather than central selection. However, the impact of aging in shaping of the peripheral TRG/TRD repertoire remains largely elusive. Next-generation sequencing analysis methods were optimized based on a spike-in method using plasmid vector DNA-samples for accurate TRG/TRD receptor diversity quantification, resulting in optimally defined primer concentrations, annealing temperatures and cycle numbers. Next, TRG/TRD repertoire diversity was evaluated during TCRγδ+ T-cell ontogeny, showing a broad, diverse repertoire in thymic and cord blood samples with Gaussian CDR3-length distributions, in contrast to the more skewed repertoire in mature circulating TCRγδ+ T-cells in adult peripheral blood. During aging the naive repertoire maintained its diversity with Gaussian CDR3-length distributions, while in the central and effector memory populations a clear shift from young (Vγ9/Vδ2 dominance) to elderly (Vγ2/Vδ1 dominance) was observed. Together with less clear Gaussian CDR3-length distributions, this would be highly suggestive of differentially heavily selected repertoires. Despite the apparent age-related shift from Vγ9/Vδ2 to Vγ2/Vδ1, no clear aging effect was observed on the Vδ2 invariant T nucleotide and canonical Vγ9-Jγ1.2 selection determinants. A more detailed look into the healthy TRG/TRD repertoire revealed known cytomegalovirus-specific TRG/TRD clonotypes in a few donors, albeit without a significant aging-effect, while Mycobacterium tuberculosis-specific clonotypes were absent. Notably, in effector subsets of elderly individuals, we could identify reported TRG and TRD receptor chains from TCRγδ+ T-cell large granular lymphocyte leukemia proliferations, which typically present in the elderly population. Collectively, our results point to relatively subtle age-related changes in the human TRG/TRD repertoire, with a clear shift in Vγ/Vδ usage in memory cells upon aging.
Keywords: TCRγδ+; aging; development; next-generation sequencing; repertoire.
Figures
Similar articles
-
Characterization of the diversity of T cell receptor γδ complementary determinant region 3 in human peripheral blood by Immune Repertoire Sequencing.J Immunol Methods. 2017 Apr;443:9-17. doi: 10.1016/j.jim.2017.01.009. Epub 2017 Jan 31. J Immunol Methods. 2017. PMID: 28159550
-
Ageing and latent CMV infection impact on maturation, differentiation and exhaustion profiles of T-cell receptor gammadelta T-cells.Sci Rep. 2017 Jul 14;7(1):5509. doi: 10.1038/s41598-017-05849-1. Sci Rep. 2017. PMID: 28710491 Free PMC article.
-
Immunophenotypic and immunogenotypic characteristics of TCRgammadelta+ T cell acute lymphoblastic leukemia.Leukemia. 1999 Feb;13(2):206-14. doi: 10.1038/sj.leu.2401276. Leukemia. 1999. PMID: 10025894
-
Evolution and function of the TCR Vgamma9 chain repertoire: It's good to be public.Cell Immunol. 2015 Jul;296(1):22-30. doi: 10.1016/j.cellimm.2015.02.010. Epub 2015 Mar 4. Cell Immunol. 2015. PMID: 25769734 Free PMC article. Review.
-
Human Peripheral Blood Gamma Delta T Cells: Report on a Series of Healthy Caucasian Portuguese Adults and Comprehensive Review of the Literature.Cells. 2020 Mar 16;9(3):729. doi: 10.3390/cells9030729. Cells. 2020. PMID: 32188103 Free PMC article. Review.
Cited by
-
Novel clonality assays for T cell lymphoma in cats targeting the T cell receptor beta, T cell receptor delta, and T cell receptor gamma loci.J Vet Intern Med. 2021 Nov;35(6):2865-2875. doi: 10.1111/jvim.16288. Epub 2021 Dec 20. J Vet Intern Med. 2021. PMID: 34929760 Free PMC article.
-
γ9δ2 T-Cell Expansion and Phenotypic Profile Are Reflected in the CDR3δ Repertoire of Healthy Adults.Front Immunol. 2022 Jul 7;13:915366. doi: 10.3389/fimmu.2022.915366. eCollection 2022. Front Immunol. 2022. PMID: 35874769 Free PMC article.
-
A Cell for the Ages: Human γδ T Cells across the Lifespan.Int J Mol Sci. 2020 Nov 24;21(23):8903. doi: 10.3390/ijms21238903. Int J Mol Sci. 2020. PMID: 33255339 Free PMC article. Review.
-
The use of non-functional clonotypes as a natural calibrator for quantitative bias correction in adaptive immune receptor repertoire profiling.Elife. 2023 Jan 24;12:e69157. doi: 10.7554/eLife.69157. Elife. 2023. PMID: 36692004 Free PMC article.
-
Natural Self-Ligand Gamma Delta T Cell Receptors (γδTCRs) Insight: The Potential of Induced IgG.Vaccines (Basel). 2020 Aug 4;8(3):436. doi: 10.3390/vaccines8030436. Vaccines (Basel). 2020. PMID: 32759782 Free PMC article.
References
Publication types
MeSH terms
Substances
LinkOut - more resources
Full Text Sources
Other Literature Sources
Medical