. 2018 Mar 6:9:39.
doi: 10.3389/fgene.2018.00039. eCollection 2018.

Griffin: A Tool for Symbolic Inference of Synchronous Boolean Molecular Networks

Affiliations

Griffin: A Tool for Symbolic Inference of Synchronous Boolean Molecular Networks

Stalin Muñoz et al. Front Genet. .

Abstract

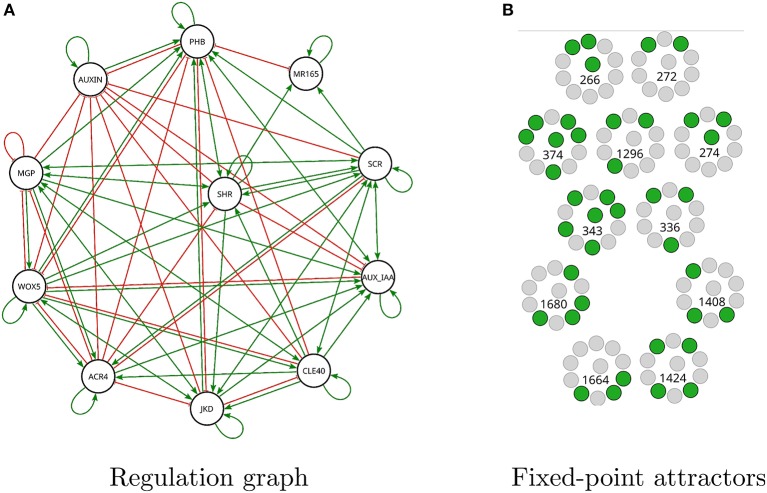
Boolean networks are important models of biochemical systems, located at the high end of the abstraction spectrum. A number of Boolean gene networks have been inferred following essentially the same method. Such a method first considers experimental data for a typically underdetermined "regulation" graph. Next, Boolean networks are inferred by using biological constraints to narrow the search space, such as a desired set of (fixed-point or cyclic) attractors. We describe Griffin, a computer tool enhancing this method. Griffin incorporates a number of well-established algorithms, such as Dubrova and Teslenko's algorithm for finding attractors in synchronous Boolean networks. In addition, a formal definition of regulation allows Griffin to employ "symbolic" techniques, able to represent both large sets of network states and Boolean constraints. We observe that when the set of attractors is required to be an exact set, prohibiting additional attractors, a naive Boolean coding of this constraint may be unfeasible. Such cases may be intractable even with symbolic methods, as the number of Boolean constraints may be astronomically large. To overcome this problem, we employ an Artificial Intelligence technique known as "clause learning" considerably increasing Griffin's scalability. Without clause learning only toy examples prohibiting additional attractors are solvable: only one out of seven queries reported here is answered. With clause learning, by contrast, all seven queries are answered. We illustrate Griffin with three case studies drawn from the Arabidopsis thaliana literature. Griffin is available at: http://turing.iimas.unam.mx/griffin.

Keywords: Boolean networks; Boolean satisfiability problem; attractors; biological constraints; clause learning; model inference; molecular networks.


Figures

Figure 1
Figure 1
Left: An R-graph G. Right: The set of all instantiations of G, GG (see definition 12). In the radial exploration strategy used by Griffin there are two centers contained in the continuous ovals. The nested dotted ovals illustrate regulation graphs that are at a certain radius from each center: continuous oval for radius 0, inner dotted ovals for radius 1, second inner dotted ovals for radius 2 and so on. In this example, each regulation graph of GG corresponds to an R-graph of a query member of a query splitting. The strategy used for this query splitting is shown in Algorithm 2. In general, the number of queries in the query splitting does not correspond to the number of instantiations of an R-graph, due to the fact that a member of the splitting may not have satisfying solutions, while all instantiations of G have satisfying solutions.
Figure 2
Figure 2
Schematic of Griffin's information flow. The query at the top-left corner is first parsed. Depending on the options it is either directly encoded into a Boolean formula or split into simpler queries. The Boolean formula is fed into a SAT solver. Each satisfying assignment returned by the SAT solver is decoded into a synchronous Boolean network, a candidate solution. It is also possible that the SAT solver concludes that the formula is a contradiction, that is, there are no synchronous Boolean networks satisfying the query. If a candidate solution is found, blocking constraints prevent finding the same solution twice. Further properties of the candidate solution are verified, possibly resulting in the generation of additional constraints. The runtime blocking analysis concludes with the rejection or acceptance of the candidate solution. If no candidate solution passes the runtime blocking analysis, then Griffin concludes there are no satisfying solutions to the query.
Figure 3
Figure 3
Regulation graphs for A. thaliana models used in the section Case Studies. (A) Flower development model of Alvarez-Buylla et al. (2010). Nodes LUG and CLF have been omitted from the diagram because they are constant inputs to the model. (B) Sepal primordium polarity model of La Rota et al. (2011). For all figures: positive regulations are shown as green lines with arrow tips, negative regulations are shown as red lines with orthogonal line tips, dashed lines represent hypothetical interactions (it is unknown whether they are present or not). Blue dashed lines with square tips represent hypothetical interactions of unknown sign. (C) Root cell stem niche model of Azpeitia et al. (2013). (D) Modified root cell stem niche model of Azpeitia et al. (2013) is shown with several new hypotheses.
Figure 4
Figure 4
A sample of 133 fixed-point attractors that are compatible with the interaction graph of Figure 3A. Black squares represent expressed genes; gray squares represent unexpressed genes. From bottom-left to top-right, there are seven groups of 19 rows and 13 columns each. Each column is labeled with a particular gene. Each row is an expression profile for the 13 genes and corresponds to a compatible fixed-point attractor for the regulations present in the interaction graph. At the top-right corner the 10 known fixed-point attractors corresponding to the cell types: inflorescence shoot apical meristem I1, I2, I3, I4; sepal SE; petal PE1, PE2; stamen ST1, ST2; and carpel CA. Nine of the 10 fixed-point attractors present in the sample have been highlighted in green. The algorithm used to generate the sample did not find the I4 profile highlighted in red.
Figure 5
Figure 5
Similarity matrix of sets of fixed-point attractors for a sample of 2,896 Boolean networks satisfying the interaction graph of A. thaliana flower model shown in Figure 3A and that do not have cyclic attractors. The similarity matrix shows the degree to which different sets of fixed-point attractors share the same elements. Each row and column represents a particular witness. The entry (i, j) represents the similarity between the fixed-point attractor sets of witness i and witness j. The maximum similarity between two networks equals 1 if they have the same set of fixed-points. Algorithm 3 ensures that the witnesses have different sets of fixed-point attractors. Therefore, the only entries in the similarity matrix that are equal to one are in the diagonal. The minimum similarity between two networks is zero. This happens when the intersection of their sets of fixed-point attractors is empty. High values of similarity are colored red while low values of similarity are colored blue. Zero similarity corresponds to black. The similarity of two sets was found using the cosine similarity given by sim(x,y)=x·yxy where x and y are binary vectors encoding the presence or absence of different fixed-point attractors.
Figure 6
Figure 6
A histogram with 30 bins, showing the distribution of entries in the similarity matrix of Figure 5. Low similarity values are more frequent than high similarities reflecting high diversity in the sets of fixed-point attractors.
Figure 7
Figure 7
Depiction of basins of attraction for the ten known fixed-point attractors corresponding to the Boolean network having the combination of basin sizes reported in the sixth row in Table 3. The biggest component with 2,488 states corresponding to ST2 is colored red, the second biggest with 2,432 states, corresponds to CA and is colored light blue, I1 is colored purple, I2 dark green, I3 dark blue, I4 orange, SE brown, PE1, the smallest component with only four states, is colored yellow, PE2 pink and ST1 light green. The fixed-point attractors are represented by bigger circles than those of non stationary states. Griffin use the algorithm of Dubrova and Teslenko (2011) to compute the attractors of the Boolean networks. Binary Decision Diagrams and the backward reachable set algorithm of Garg et al. (2008) are applied to each attractor to compute their corresponding basins.
Figure 8
Figure 8
Center-radius exploration strategy for the sepal model. Values have been normalized by their maximum in each category. The number of R-graphs grows rapidly with the radius. It is given by the binomial coefficient (hr), where h is the number of hypotheses and r the radius. It can be seen that the computing time is highly correlated with the number of cumulative satisfying networks.
Figure 9
Figure 9
Modified A. thaliana root Boolean network found by Griffin satisfying question 7. (A) Interaction graph of the solution has 83 regulations of the 90 possible (see Figure 3D). (B) There are 11 fixed-point attractors in the solution. For each expression profile active genes are shown in green while inactive genes are shown in gray. The number corresponds to the decimal notation used in Table S1 in Supplementary Material.

Similar articles

Cited by

References

    1. Akutsu T., Miyano S., Kuhara S. (1999). Identification of genetic networks from a small number of gene expression patterns under the Boolean network model, in Pacific Symposium on Biocomputing, Vol. 4 (Hawaii: ), 17–28. - PubMed
    1. Albert R., Othmer H. G. (2003). The topology of the regulatory interactions predicts the expression pattern of the segment polarity genes in Drosophila melanogaster. J. Theor. Biol. 223, 1–18. 10.1016/S0022-5193(03)00035-3 - DOI - PMC - PubMed
    1. Alvarez-Buylla E. R., Benítez M., Corvera-Poiré A., Chaos Cador Á., de Folter S., Gamboa de Buen A., et al. . (2010). Flower development. Arabidopsis Book 8:e0127. 10.1199/tab.0127 - DOI - PMC - PubMed
    1. Arellano G., Argil J., Azpeitia E., Benítez M., Carrillo M., Góngora P., et al. . (2011). “Antelope”: a hybrid-logic model checker for branching-time Boolean GRN analysis. BMC Bioinformatics 12:490. 10.1186/1471-2105-12-490 - DOI - PMC - PubMed
    1. Azpeitia E., Benítez M., Vega I., Villarreal C., Alvarez-Buylla E. R. (2010). Single-cell and coupled GRN models of cell patterning in the Arabidopsis thaliana root stem cell niche. BMC Syst. Biol. 4:1. 10.1186/1752-0509-4-134 - DOI - PMC - PubMed