

Mechanisms and applications of cyclometalated Pt(ii) complexes in photoredox catalytic trifluoromethylation
- PMID: 29560234
- PMCID: PMC5811153
- DOI: 10.1039/c4sc02537g
Mechanisms and applications of cyclometalated Pt(ii) complexes in photoredox catalytic trifluoromethylation
Abstract
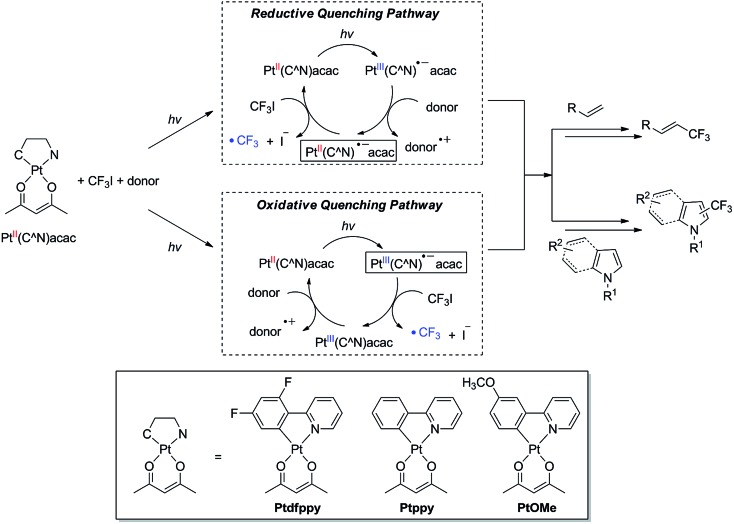
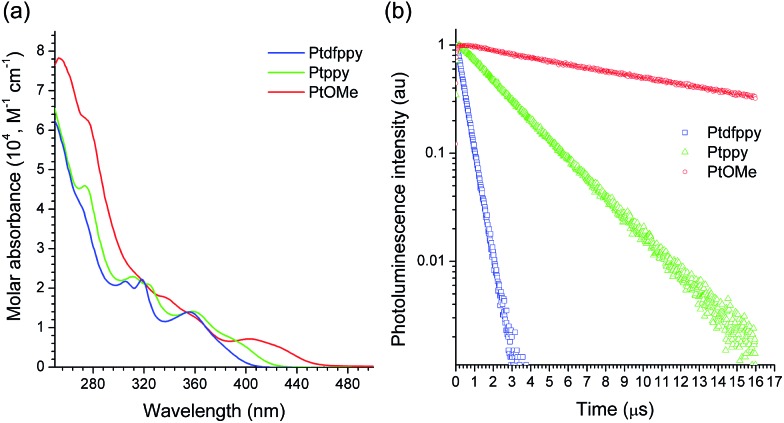
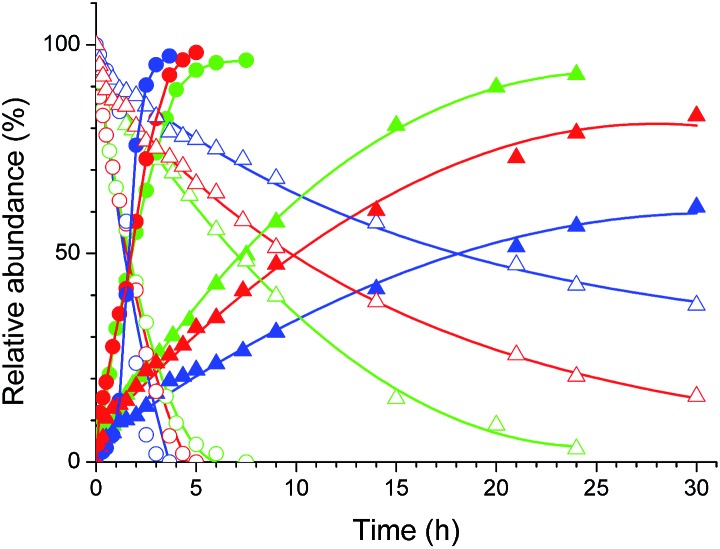
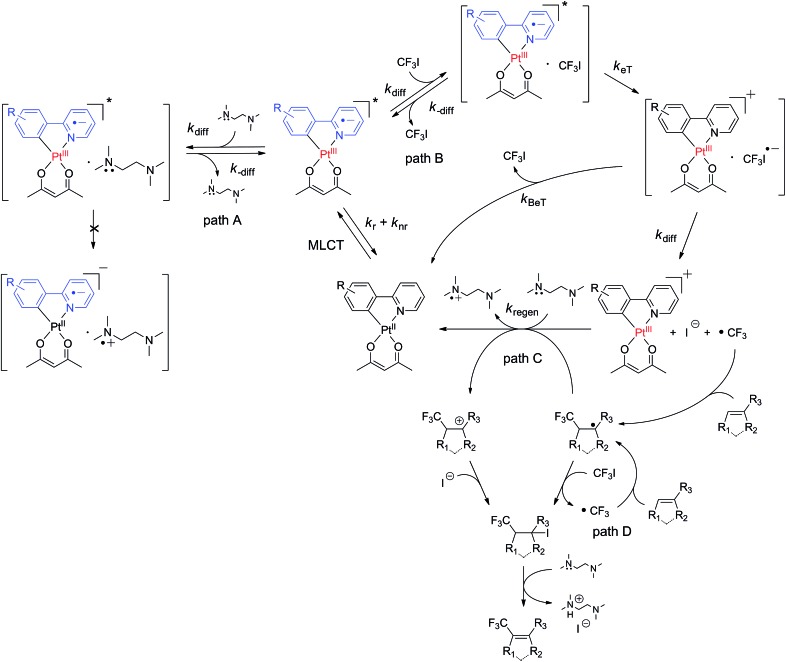
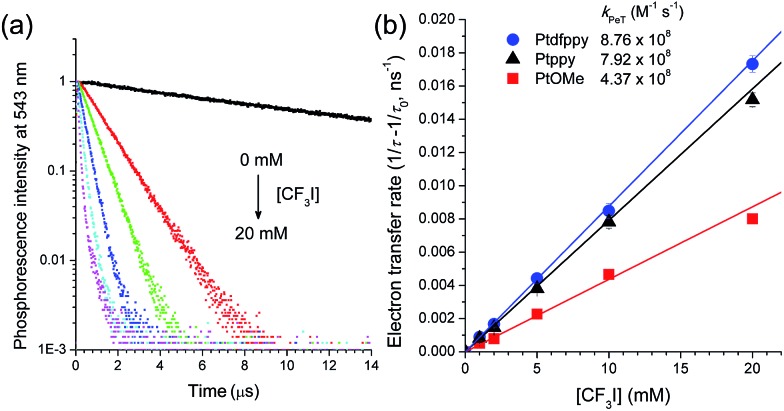
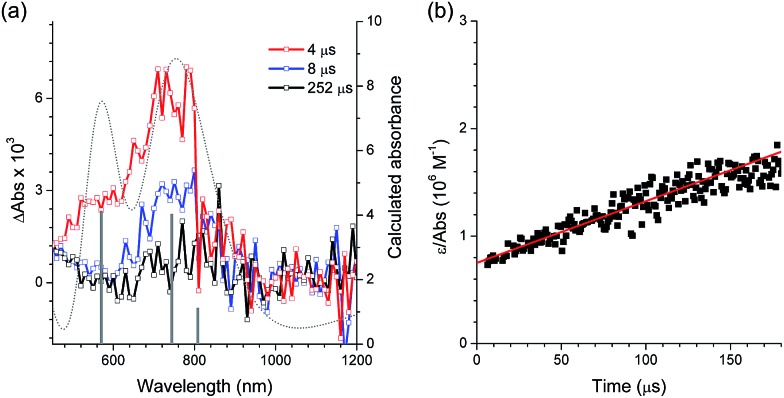
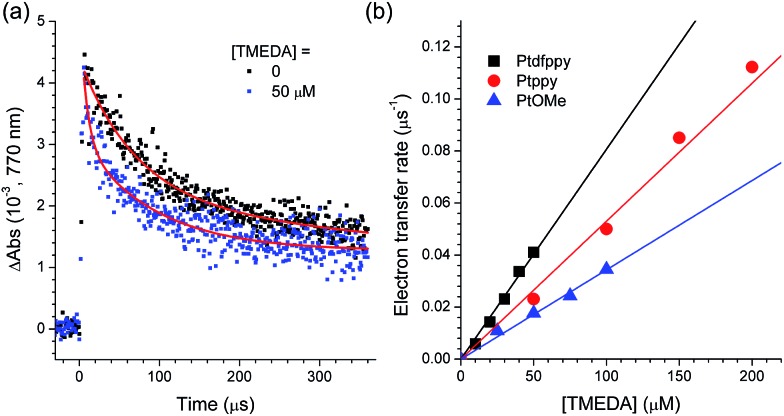
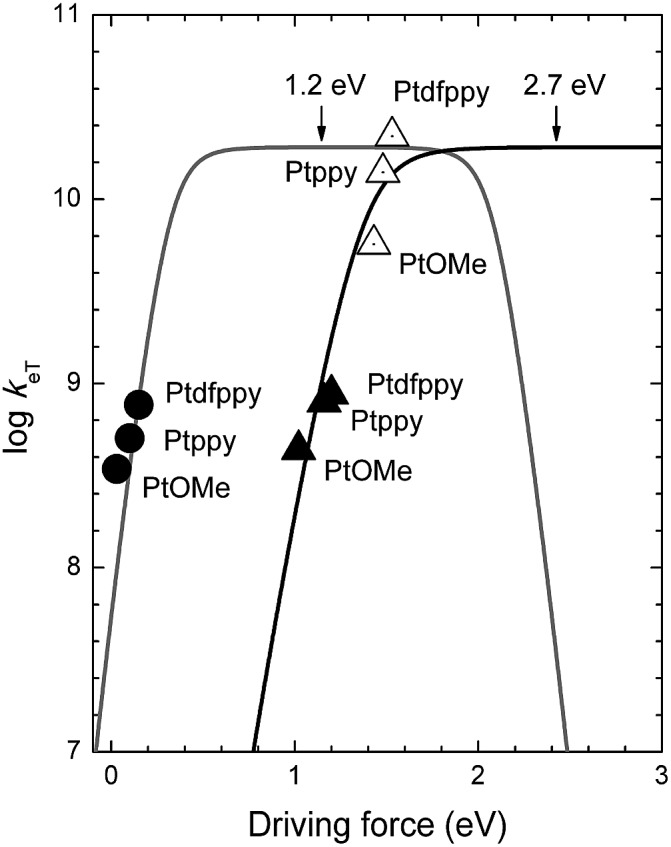
The incorporation of a trifluoromethyl group into an existing scaffold can provide an effective strategy for designing new drugs and agrochemicals. Among the numerous approaches to trifluoromethylation, radical trifluoromethylation mediated by visible light-driven photoredox catalysis has gathered significant interest as it offers unique opportunities for circumventing the drawbacks encountered in conventional methods. A limited understanding of the mechanism and molecular parameters that control the catalytic actions has hampered the full utilization of photoredox catalysis reactions. To address this challenge, we evaluated and investigated the photoredox catalytic trifluoromethylation reaction using a series of cyclometalated Pt(ii) complexes with systematically varied ligand structures. The Pt(ii) complexes were capable of catalyzing the trifluoromethylation of non-prefunctionalized alkenes and heteroarenes in the presence of CF3I under visible light irradiation. The high excited-state redox potentials of the complexes permitted oxidative quenching during the cycle, whereas reductive quenching was forbidden. Spectroscopic measurements, including time-resolved photoluminescence and laser flash photolysis, were performed to identify the catalytic intermediates and directly monitor their conversions. The mechanistic studies provide compelling evidence that the catalytic cycle selects the oxidative quenching pathway. We also found that electron transfer during each step of the cycle strictly adhered to the Marcus normal region behaviors. The results are fully supported by additional experiments, including photoinduced ESR spectroscopy, spectroelectrochemical measurements, and quantum chemical calculations based on time-dependent density functional theory. Finally, quantum yields exceeding 100% strongly suggest that radical propagation significantly contributes to the catalytic trifluoromethylation reaction. These findings establish molecular strategies for designing trifluoromethyl sources and catalysts in an effort to enhance catalysis performance.
Figures
Similar articles
-
Synthetic and Mechanistic Implications of Chlorine Photoelimination in Nickel/Photoredox C(sp3)-H Cross-Coupling.Acc Chem Res. 2021 Feb 16;54(4):988-1000. doi: 10.1021/acs.accounts.0c00694. Epub 2021 Jan 29. Acc Chem Res. 2021. PMID: 33511841 Free PMC article.
-
Understanding the Kinetics and Spectroscopy of Photoredox Catalysis and Transition-Metal-Free Alternatives.Acc Chem Res. 2016 Jun 21;49(6):1320-30. doi: 10.1021/acs.accounts.6b00012. Epub 2016 Mar 29. Acc Chem Res. 2016. PMID: 27023767
-
Steering Asymmetric Lewis Acid Catalysis Exclusively with Octahedral Metal-Centered Chirality.Acc Chem Res. 2017 Feb 21;50(2):320-330. doi: 10.1021/acs.accounts.6b00586. Epub 2017 Jan 27. Acc Chem Res. 2017. PMID: 28128920
-
Oxidative trifluoromethylation and trifluoromethylthiolation reactions using (trifluoromethyl)trimethylsilane as a nucleophilic CF3 source.Acc Chem Res. 2014 May 20;47(5):1513-22. doi: 10.1021/ar4003202. Epub 2014 Apr 28. Acc Chem Res. 2014. PMID: 24773518 Review.
-
Redox catalysis via photoinduced electron transfer.Chem Sci. 2023 Mar 8;14(16):4205-4218. doi: 10.1039/d2sc07101k. eCollection 2023 Apr 26. Chem Sci. 2023. PMID: 37123199 Free PMC article. Review.
Cited by
-
Selectivity in the Addition of Electron Deficient Radicals to the C2 Position of Indoles.European J Org Chem. 2020 Sep 30;2020(36):5828-5832. doi: 10.1002/ejoc.201901784. Epub 2020 Aug 18. European J Org Chem. 2020. PMID: 33692651 Free PMC article.
-
Luminescent Platinum(II) Complexes with Terdentate N∧C∧C Ligands.Inorg Chem. 2023 Dec 25;62(51):20987-21002. doi: 10.1021/acs.inorgchem.3c02399. Epub 2023 Dec 5. Inorg Chem. 2023. PMID: 38051299 Free PMC article.
-
Metal-free oxidative trifluoromethylation of indoles with CF3SO2Na on the C2 position.RSC Adv. 2019 Oct 30;9(60):35098-35101. doi: 10.1039/c9ra07785e. eCollection 2019 Oct 28. RSC Adv. 2019. PMID: 35530675 Free PMC article.
-
HiREX: High-Throughput Reactivity Exploration for Extended Databases of Transition-Metal Catalysts.J Chem Inf Model. 2023 Oct 9;63(19):6081-6094. doi: 10.1021/acs.jcim.3c00660. Epub 2023 Sep 22. J Chem Inf Model. 2023. PMID: 37738303 Free PMC article.
-
Highly luminescent palladium(ii) complexes with sub-millisecond blue to green phosphorescent excited states. Photocatalysis and highly efficient PSF-OLEDs.Chem Sci. 2016 Sep 1;7(9):6083-6098. doi: 10.1039/c6sc00462h. Epub 2016 Jun 15. Chem Sci. 2016. PMID: 30034749 Free PMC article.
References
-
- Hoffmann N. Photochem. Photobiol. Sci. 2012;11:1613–1641. - PubMed
-
- Hopkinson M. N., Sahoo B., Li J.-L., Glorius F. Chem.–Eur. J. 2014;20:3874–3886. - PubMed
-
- Inagaki A., Akita M. Coord. Chem. Rev. 2010;254:1220–1239.
-
- Koike T., Akita M. Synlett. 2013;24:2492–2505.
-
- Narayanam J. M. R., Stephenson C. R. J. Chem. Soc. Rev. 2011;40:102–113. - PubMed
LinkOut - more resources
Full Text Sources
Other Literature Sources
Miscellaneous