. 2018 Mar 13:4:12.
doi: 10.1038/s41421-018-0009-2. eCollection 2018.

Crystal structure of the human 5-HT1B serotonin receptor bound to an inverse agonist

Affiliations

Crystal structure of the human 5-HT1B serotonin receptor bound to an inverse agonist

Wanchao Yin et al. Cell Discov. .

Abstract

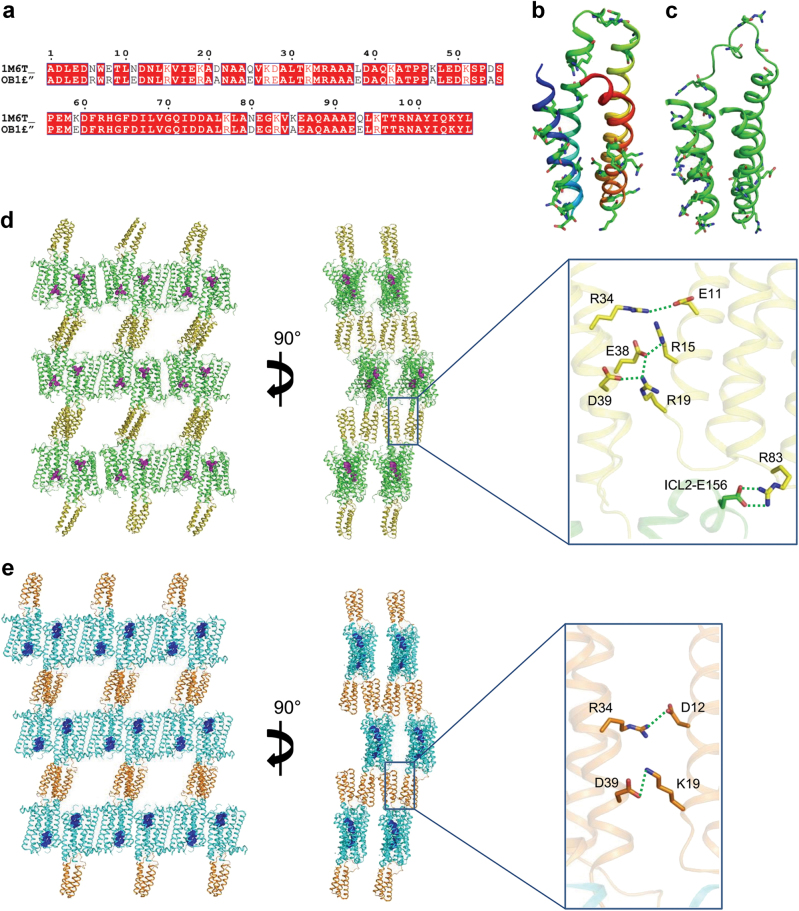
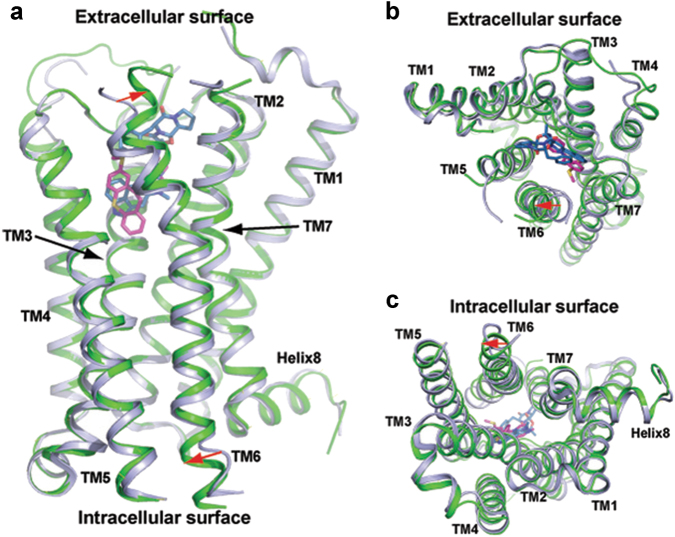
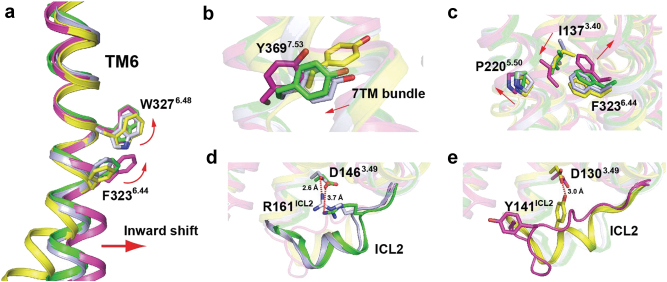
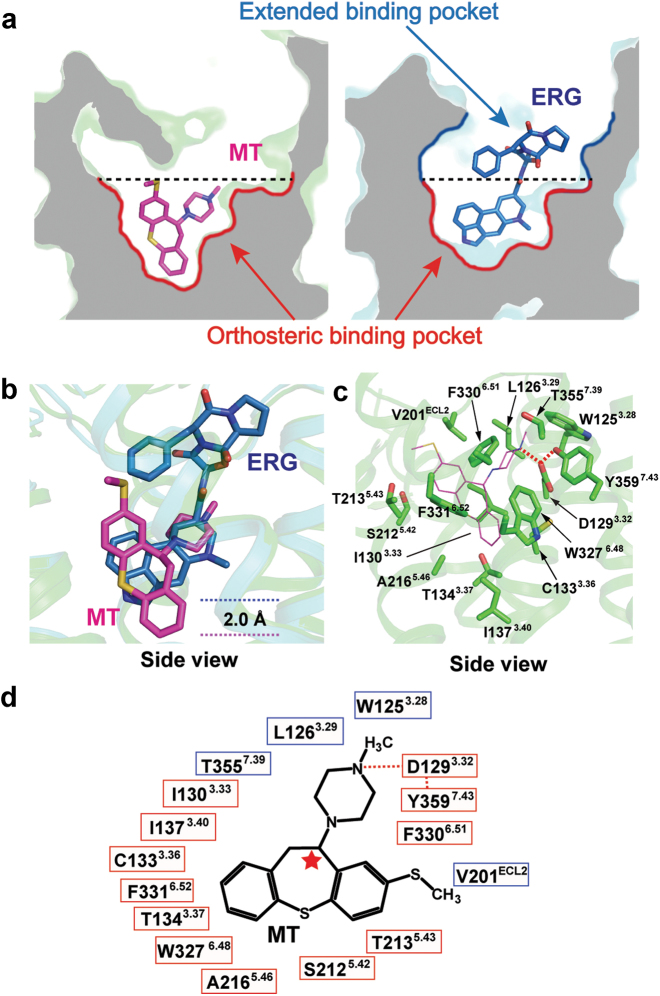
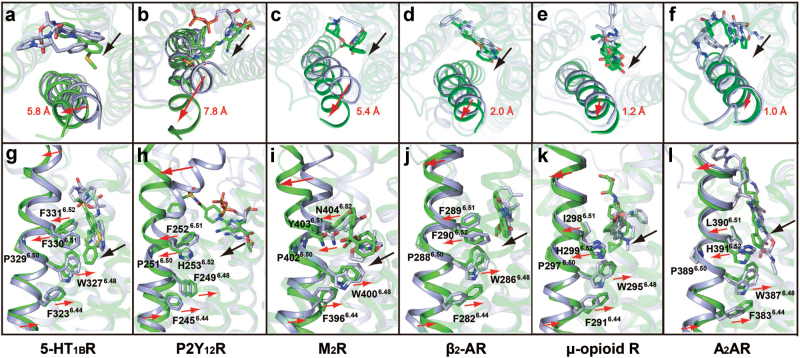
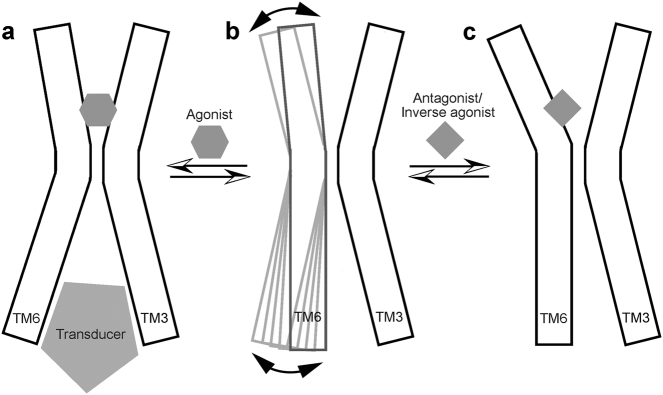
5-hydroxytryptamine (5-HT, also known as serotonin) regulates many physiological processes through the 5-HT receptor family. Here we report the crystal structure of 5-HT1B subtype receptor (5-HT1BR) bound to the psychotropic serotonin receptor inverse agonist methiothepin (MT). Crystallization was facilitated by replacing ICL3 with a novel optimized variant of BRIL (OB1) that enhances the formation of intermolecular polar interactions, making OB1 a potential useful tool for structural studies of membrane proteins. Unlike the agonist ergotamine (ERG), MT occupies only the conserved orthosteric binding pocket, explaining the wide spectrum effect of MT on serotonin receptors. Compared with ERG, MT shifts toward TM6 and sterically pushes residues W3276.48, F3306.50 and F3316.51 from inside the orthosteric binding pocket, leading to an outward movement of the extracellular end and a corresponding inward shift of the intracellular end of TM6, a feature shared by other reported inactive G protein-coupled receptor (GPCR) structures. Together with the previous agonist-bound serotonin receptor structures, the inverse agonist-bound 5-HT1BR structure identifies a basis for the ligand-mediated switch of 5-HT1BR activity and provides a structural understanding of the inactivation mechanism of 5-HT1BR and some other class A GPCRs, characterized by ligand-induced outward movement of the extracellular end of TM6 that is coupled with inward movement of the cytoplasmic end of this helix.


Conflict of interest statement

The authors declare that they have no conflict of interest.

Figures

Fig. 1
Fig. 1. The fusion partner OB1 facilitates crystallization of the 5-HT1BR- inverse agonist MT complex.
a Sequence alignment of BRIL and OB1 showing the mutations introduced into BRIL (PDB code: 1M6T) to improve crystallization of fusion proteins. b BRIL structural model shown in rainbow colors (N terminus, blue; C terminus, red) with mutated residues displayed as sticks. c Structural model of the OB1 fusion protein in the structure of 5-HT1BR/MT complex, with mutated residues shown as sticks. d Two crystal packing views of the 5-HT1BR/MT complex along cell axes b (left) and c (right) in the space group C2. Details of the polar interactions between neighboring symmetry OB1 molecules are shown in the box on the right. 5-HT1BR is in green, BRIL fusion partner in orange-olive, and the ligand MT in magenta. The interactions between interface residues of the neighboring OB1 molecules can be defined by electron density or by computational modeling for those whose side chains lack clear electron density. e Two views of crystal packing of the 5-HT1BR/ERG complex in the space group C2 with the detailed polar interactions mediated by BRIL shown in the box on the right. 5-HT1BR is shown in cyan, BRIL fusion protein in orange and the ligand ERG in blue
Fig. 2
Fig. 2. 5-HT1BR/MT complex crystal structure and its comparison with 5-HT1BR/ERG complex.
a Superposition of 5-HT1BR/MT with 5-HT1BR/ERG structures (PDB code: 4IAR), a side view, b an extracellular view, and c an intracellular view. 5-HT1BR/MT complex is shown in green/magenta and 5-HT1BR/ERG in light blue/dark blue. The red arrow indicates the movement of TM6 in the 5-HT1BR/MT structure compared to that of 5-HT1BR/ERG
Fig. 3
Fig. 3. The 5-HT1BR/MT structure represents an intermediate state between active and inactive conformations.
a The conformation of TM6 of the 5-HT1BR/MT complex (green) is compared with those of 5-HT1BR/ERG (PDB code: 4IAR, light blue), β2-AR/carazolol (inverse agonist, PDB code: 2RH1, magenta), and β2-AR/BI-167107 (agonist, PDB code: 3SN6, yellow). b, c Shifts of conserved residues in “micro switches” indicates that the 5-HT1BR/MT complex is largely in an inactive conformation. b “NPxxY”; and c “P-I-F”. Amino acid number labeling is based on the sequence of 5-HT1BR. Red arrows indicate the displacements of TM6 and its residues in inactive conformations compared with those in active ones. Side chains of conserved residues are shown as sticks. d, e Side chains of residues in micro switch “DRY”. D1463.19 can form salt bridges within R161ICL2 in both 5-HT1BR/MT and 5-HT1BR/ERG structures (d), while a similar polar interaction can only be observed in β2-AR/BI-167107 structure between D1303.49 and Y141ICL2 (e)
Fig. 4
Fig. 4. Ligand binding pockets of 5-HT1BR in complex with MT and ERG.
a Overall presentation of 5-HT1BR ligand binding pockets in complex with MT (left) and ERG (right). The orthosteric and extended binding pockets are shown in red and blue, respectively. b The superposition of MT (magenta) and ERG (blue) in the 5-HT1BR ligand binding pockets. MT lies in the pocket 2.0 Å deeper than ERG. c MT in the ligand binding pocket with surrounding receptor residues. MT is shown as magenta line model. Residues in the pocket are shown as green sticks. d Schematic 2D presentation of interactions between 5-HT1BR and MT. Residues in the orthosteric pocket are shown in red boxes, and residues in the extended binding pocket are presented in blue boxes. Polar interactions are shown as red dashed lines. The chiral carbon atom within the MT S-isomer is labeled with a red star
Fig. 5
Fig. 5. Structure alignment of TM6 and ligands of class A GPCR complexes.
af Extracellular views of TM6 and ligands. gl Side views of TM6 and ligands. a and g 5-HT1BR in complex with inverse agonist MT vs. agonist ERG (PDB code: 4IAR), b and h P2Y12R in complex with antagonist AZD1283 (PDB code: 4NTJ) vs. agonist 2MeSADP (PDB code: 4PXZ), c and i M2R in complex with inverse agonist QNB (PDB code: 3UON) vs. agonist iperoxo (PDB code: 4MQT), d and j β2-AR in complex with inverse agonist carazolol (PDB code: 2RH1) vs. agonist BI-167107 (PDB code: 3SN6), e and k μ-opioid R in complex with antagonist β-FNA (PDB code: 4DKL) vs. agonist BU72 (PDB code: 5C1M), f and l A2AR in complex with antagonist ZM241385 (PDB code: 4EIY) vs. agonist UK-432097 (PDB code: 3QAK). Red arrows indicate the movements of TM6 and the side chains of highly conserved residues at positions 6.44, 6.48, 6.51, and 6.52, and black arrows show the shifts of inverse agonists/antagonists compared with agonists in the ligand binding pockets. All GPCRs in inactive conformation are shown in green, while those in active conformation are displayed in light blue. Inverse agonists/antagonists are colored green, and agonists are in light blue. The shift distances of extracellular ends of TM6 between active and inactive conformations are labeled in red with residues at position 6.60 as reference point
Fig. 6
Fig. 6. Schematic illustration of a putative mechanism of activation/inactivation of 5-HT1BR and other class A GPCRs.
a GPCRs are activated by agonist binding and transduce extracellular signals to downstream pathways through recruiting effectors. Agonist is shown as grey hexagon, and transducer as grey pentagon. b GPCRs in ground state. c GPCRs inhibited by binding to antagonist or inverse agonist. Antagonist/inverse agonist is shown as grey square

References

    1. Zhao Q, Wu BL. Ice breaking in GPCR structural biology. Acta Pharmacol. Sin. 2012;33:324–334. doi: 10.1038/aps.2011.187. - DOI - PMC - PubMed
    1. Rosenbaum DM, et al. GPCR engineering yields high-resolution structural insights into beta2-adrenergic receptor function. Science. 2007;318:1266–1273. doi: 10.1126/science.1150609. - DOI - PubMed
    1. White JF, et al. Structure of the agonist-bound neurotensin receptor. Nature. 2012;490:508–513. doi: 10.1038/nature11558. - DOI - PMC - PubMed
    1. Thorsen Thor S, Matt R, Weis William I, Kobilka Brian K. Modified T4 lysozyme fusion proteins facilitate G protein-coupled receptor crystallogenesis. Structure. 2014;22:1657–1664. doi: 10.1016/j.str.2014.08.022. - DOI - PMC - PubMed
    1. Chun E, et al. Fusion partner toolchest for the stabilization and crystallization of G protein-coupled receptors. Structure. 2012;20:967–976. doi: 10.1016/j.str.2012.04.010. - DOI - PMC - PubMed

LinkOut - more resources