

Increase in hepatic and decrease in peripheral insulin clearance characterize abnormal temporal patterns of serum insulin in diabetic subjects
- PMID: 29560274
- PMCID: PMC5852153
- DOI: 10.1038/s41540-018-0051-6
Increase in hepatic and decrease in peripheral insulin clearance characterize abnormal temporal patterns of serum insulin in diabetic subjects
Abstract
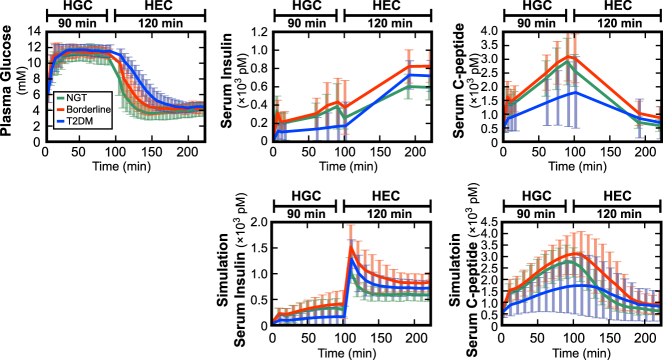
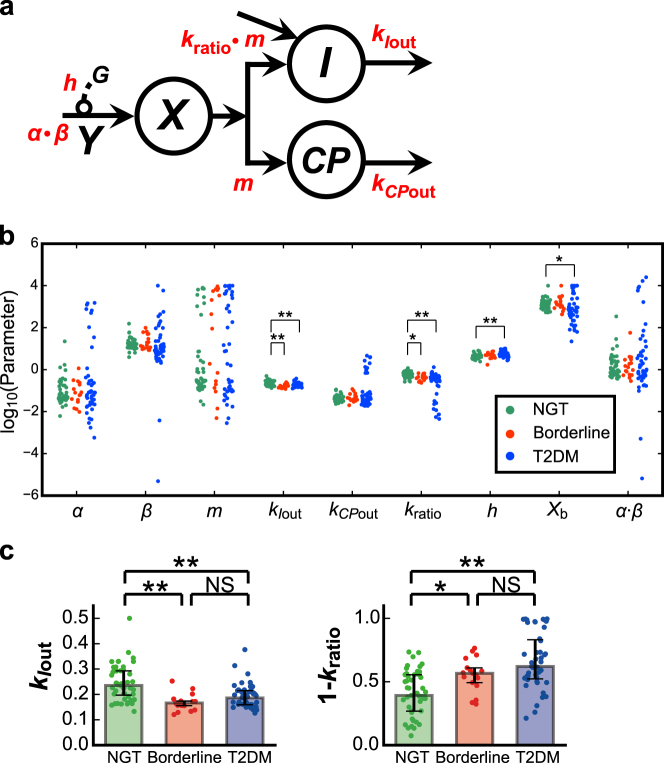
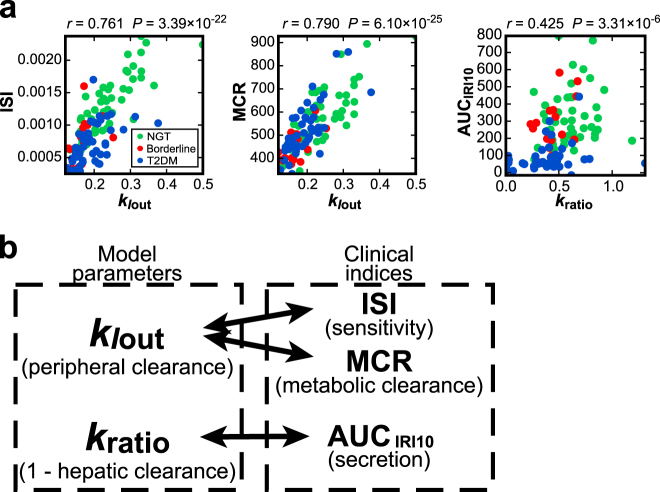
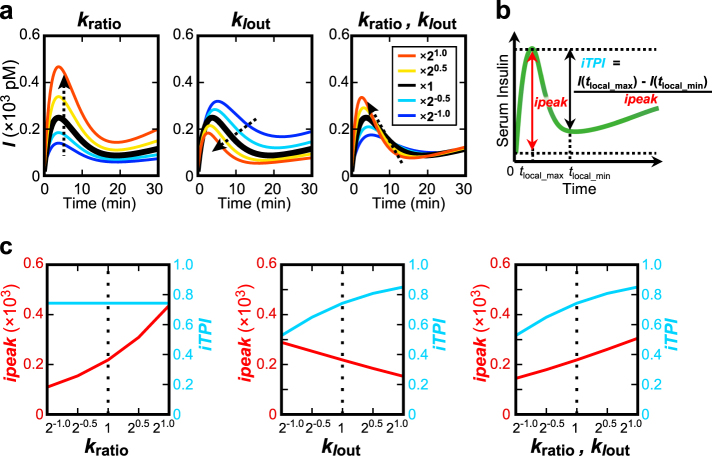
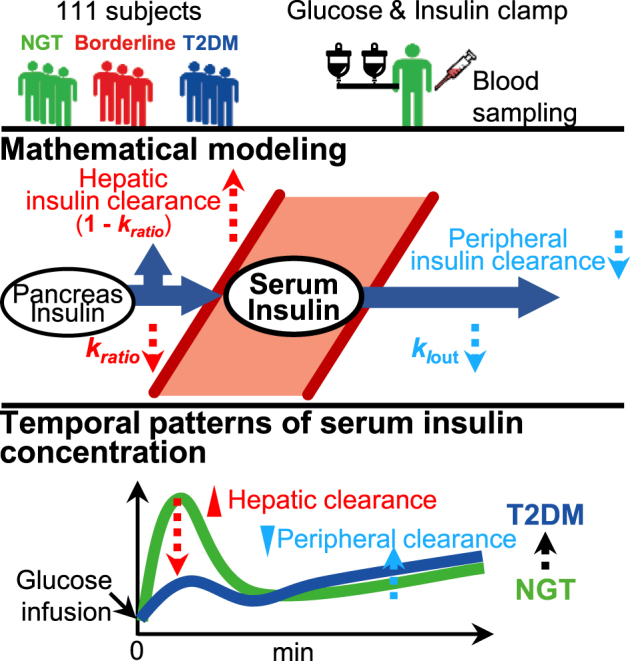
Insulin plays a central role in glucose homeostasis, and impairment of insulin action causes glucose intolerance and leads to type 2 diabetes mellitus (T2DM). A decrease in the transient peak and sustained increase of circulating insulin following an infusion of glucose accompany T2DM pathogenesis. However, the mechanism underlying this abnormal temporal pattern of circulating insulin concentration remains unknown. Here we show that changes in opposite direction of hepatic and peripheral insulin clearance characterize this abnormal temporal pattern of circulating insulin concentration observed in T2DM. We developed a mathematical model using a hyperglycemic and hyperinsulinemic-euglycemic clamp in 111 subjects, including healthy normoglycemic and diabetic subjects. The hepatic and peripheral insulin clearance significantly increase and decrease, respectively, from healthy to borderline type and T2DM. The increased hepatic insulin clearance reduces the amplitude of circulating insulin concentration, whereas the decreased peripheral insulin clearance changes the temporal patterns of circulating insulin concentration from transient to sustained. These results provide further insight into the pathogenesis of T2DM, and thus may contribute to develop better treatment of this condition.
Conflict of interest statement
The authors declare no competing interests.
Figures
Similar articles
-
Glucose Homeostatic Law: Insulin Clearance Predicts the Progression of Glucose Intolerance in Humans.PLoS One. 2015 Dec 1;10(12):e0143880. doi: 10.1371/journal.pone.0143880. eCollection 2015. PLoS One. 2015. PMID: 26623647 Free PMC article.
-
Effect of pioglitazone on circulating adipocytokine levels and insulin sensitivity in type 2 diabetic patients.J Clin Endocrinol Metab. 2004 Sep;89(9):4312-9. doi: 10.1210/jc.2004-0190. J Clin Endocrinol Metab. 2004. PMID: 15356026 Clinical Trial.
-
Tumor necrosis factor alpha and insulin resistance in obese type 2 diabetic patients.Int J Obes Relat Metab Disord. 2003 Jan;27(1):88-94. doi: 10.1038/sj.ijo.0802187. Int J Obes Relat Metab Disord. 2003. PMID: 12532159
-
Increased liver fat, impaired insulin clearance, and hepatic and adipose tissue insulin resistance in type 2 diabetes.Gastroenterology. 2008 Jul;135(1):122-30. doi: 10.1053/j.gastro.2008.03.021. Epub 2008 Mar 21. Gastroenterology. 2008. PMID: 18474251
-
Regulation of urea synthesis by diet protein and carbohydrate in normal man and in patients with cirrhosis. Relationship to glucagon and insulin.Dan Med Bull. 1997 Jun;44(3):225-41. Dan Med Bull. 1997. PMID: 9233544 Review.
Cited by
-
Athrixia phylicoides tea infusion (bushman tea) improves adipokine balance, glucose homeostasis and lipid parameters in a diet-induced metabolic syndrome rat model.BMC Complement Med Ther. 2021 Nov 29;21(1):292. doi: 10.1186/s12906-021-03459-z. BMC Complement Med Ther. 2021. PMID: 34844584 Free PMC article.
-
Hepatic Insulin Clearance: Mechanism and Physiology.Physiology (Bethesda). 2019 May 1;34(3):198-215. doi: 10.1152/physiol.00048.2018. Physiology (Bethesda). 2019. PMID: 30968756 Free PMC article. Review.
-
Loss of Znt8 function in diabetes mellitus: risk or benefit?Mol Cell Biochem. 2021 Jul;476(7):2703-2718. doi: 10.1007/s11010-021-04114-4. Epub 2021 Mar 5. Mol Cell Biochem. 2021. PMID: 33666829 Review.
-
Conditional universal differential equations capture population dynamics and interindividual variation in c-peptide production.NPJ Syst Biol Appl. 2025 Jul 31;11(1):84. doi: 10.1038/s41540-025-00570-6. NPJ Syst Biol Appl. 2025. PMID: 40744933 Free PMC article.
-
Targeting Insulin-Degrading Enzyme in Insulin Clearance.Int J Mol Sci. 2021 Feb 24;22(5):2235. doi: 10.3390/ijms22052235. Int J Mol Sci. 2021. PMID: 33668109 Free PMC article. Review.
References
LinkOut - more resources
Full Text Sources
Other Literature Sources
