. 2018 Jan 29;5(3):280-296.
doi: 10.1002/acn3.528. eCollection 2018 Mar.

De novo variants in CAMK2A and CAMK2B cause neurodevelopmental disorders

Affiliations

De novo variants in CAMK2A and CAMK2B cause neurodevelopmental disorders

Tenpei Akita et al. Ann Clin Transl Neurol. .

Abstract

Objective: α (CAMK2A) and β (CAMK2B) isoforms of Calcium/calmodulin-dependent protein kinase II (CaMKII) play a pivotal role in neuronal plasticity and in learning and memory processes in the brain. Here, we explore the possible involvement of α- and β-CaMKII variants in neurodevelopmental disorders.

Methods: Whole-exome sequencing was performed for 976 individuals with intellectual disability, developmental delay, and epilepsy. The effect of CAMK2A and CAMK2B variants on CaMKII structure and firing of neurons was evaluated by computational structural analysis, immunoblotting, and electrophysiological analysis.

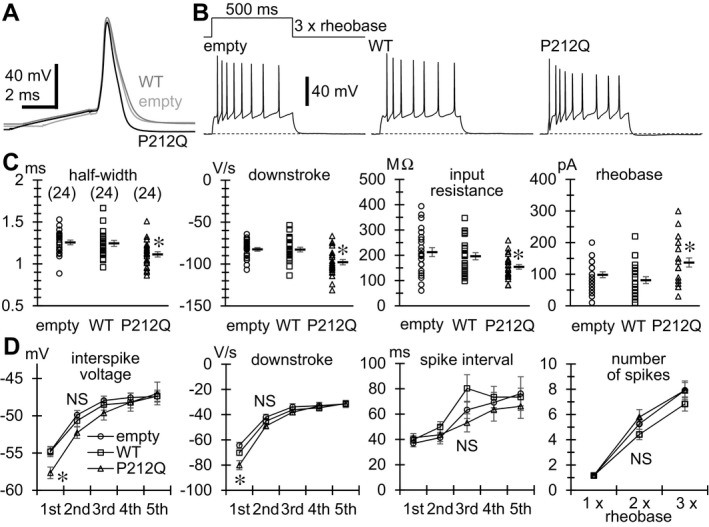
Results: We identified a total of five de novo CAMK2A and CAMK2B variants in three and two individuals, respectively. Seizures were common to three individuals with CAMK2A variants. Using a minigene splicing assay, we demonstrated that a splice site variant caused skipping of exon 11 leading to an in-frame deletion of the regulatory segment of CaMKII α. By structural analysis, four missense variants are predicted to impair the interaction between the kinase domain and the regulatory segment responsible for the autoinhibition of its kinase activity. The Thr286/Thr287 phosphorylation as a result of release from autoinhibition was increased in three mutants when the mutants were stably expressed in Neuro-2a neuroblastoma cells. Expression of a CaMKII α mutant in primary hippocampal neurons significantly increased A-type K+ currents, which facilitated spike repolarization of single action potentials.

Interpretation: Our data highlight the importance of CaMKII α and CaMKII β and their autoinhibitory regulation in human brain function, and suggest the enhancement of A-type K+ currents as a possible pathophysiological basis.


Figures

Figure 1
Figure 1
De novo CAMK2A and CAMK2B variants in individuals with neurodevelopmental disorders. Schematic representation of domain structures of CaMKII α and CaMKII β. About CaMKII α, its isoform 2 (NP_741960.1), which differs from the isoform 1 (NP_057065.2) in length of linker region, is shown because this isoform has been well examined.2 The numbers indicate the positions of amino acid residues. Thr286 in CaMKII α and Thr287 in CaMKII β are shown in red. All the missense variants occurred at evolutionarily conserved amino acids, and a splice site variant caused in‐frame deletion of the regulatory segment including Thr286. All the variants were confirmed as de novo. Homologous sequences were aligned using the CLUSTALW web site (http://www.genome.jp/tools/clustalw/). The protein sequences are NP_057065.2 (Homo sapiens CaMKII α), NP_001211.3 (Homo sapiens CaMKII β), NP_803126.1 (Mus musculus CaMKII α), NP_001167524.1 (Mus musculus CaMKII β), NP_001093737.1 (Xenopus tropicalis CaMKII α), NP_001072917.1 (Xenopus tropicalis CaMKII β), and AAF63320.1 (Caenorhabditis elegans CaMKII).
Figure 2
Figure 2
Aberrant splicing of CAMK2A caused by c.817‐1G>A variant. (A) Schematic representation of a minigene construct containing a genomic DNA from exon 10 to exon 12. Exons, introns, and primers are shown by box with exon number, dashed lines, and arrows, respectively. (B) (left panel) RTPCR analysis showed normal splicing of wild‐type constructs, but aberrant splicing (white asterisks) of mutant constructs with the c.817G>A. Two bands (white dots) were proven to be heteoduplexed products because these bands disappeared after T7 endonuclease digestion (right panel). Both mock transfected sample and minus reverse transcriptase control with no reverse transcriptase showed no detectable products. (C) Sequence of the PCR products revealed that three types of aberrant splicing were caused by the variant. Two would result in frameshift, and one leads to an in‐frame deletion (p.His273_Lys300del).
Figure 3
Figure 3
EEG of individuals with CAMK2A or CAMK2B variants. (A–C) EEG of individual 2 with a CAMK2A variant. Interictal recording at 4 months of age shows a pseudoperiodic background of irregular high‐amplitude slow waves mixed with multifocal paroxysmal discharges and low‐amplitude fast waves (A), which findings are consistent with hypsarrhythmia characteristically seen in patients with infantile spasms or West syndrome. At the age of 8 months (B and C), interictal recording shows intermittent symmetrical occipital polyspike‐and‐slow waves (B), while ictal recording when the patient had breath‐holding and pale face shows right occipital‐dominant hemispherical fast waves (C). (D–G) EEG of individual 4 with a CAMK2B variant at 3 years and 9 months of age. Interictal recording during sleep shows focal spike‐and‐slow waves at left frontopolar (Fp1) region (D). Ictal recordings at status epilepticus show that frequent spike‐and‐slow waves originate from Fp1, then shift to Fp1‐dominant 7 Hz fast waves (E). At 23 min after the onset of ictal discharges, the patient showed clonic convulsions at right upper extremity with 1.5 Hz continuous spike‐and‐slow wave complexes at left hemisphere (F). At 40 min after the onset of ictal discharges, right hemiclonic convulsions gradually ceased. However, EEG still shows 1.5 Hz continuous spike‐and‐slow wave complexes at left hemisphere (G). EEG, electroencephalogram.
Figure 4
Figure 4
Brain magnetic resonance imaging of individuals with CAMK2A or CAMK2B variants. (A–D) T2‐weighted images of individual 3 at 2 years of age (A and C) and at 9 years of age (B and D). Cerebral hemispheres show normal findings (A and B), while the cerebellum show atrophic changes in both hemispheres and vermis with dilated sulci and fourth ventricle (D). (E and F) T1‐weighted images of individual 5 at 12 months of age (E) and at 4 years of age (F). As shown in individual 3, individual 5 also shows progressive cerebellar atrophy with dilated fourth ventricle and foramen magnum (F).
Figure 5
Figure 5
CAMK2A and CAMK2B variants affect autoinhibition of CaMKII activity. (A) Mapping of the found variants on the crystal structure of CaMKII α. An overall view of the crystal structure of human CaMKII α in complex with an inhibitor bosutinib (PDB code 3soa) and a close‐up view of that in complex with an inhibitor indirubin E804 (PDB code 2vz6) are shown. The kinase domain, regulatory segment, linker region and association domain are colored wheat, pale green, pale blue and gray, respectively. The kinase inhibitor bosutinib is depicted as gray sticks. Residues at the variant sites are displayed as red spheres or sticks. In the close‐up view of the white rectangular region, the side chains involved in a hydrophobic core with the mutated proline residues are shown as van der Waals spheres. Ca2+/calmodulin‐dependent autophosphorylation site (Thr286 of CaMKII α) is indicated as orange spheres. Black dotted lines represent hydrogen bonds. The bar graph below shows free energy changes upon the amino acid changes predicted by the FoldX software.27 Colors of the bars correspond to the mutated molecular areas. The FoldX calculation was performed using the crystal structure of human CaMKII α (PDB code 2vz6). (B) Immunoblot analysis using an antiphospho‐Thr286/Thr287 CaMKII antibody (p‐CaMKII) and an anti‐GFP antibody (GFP) with Neuro‐2a cells expressing EGFP‐tagged CAMK2A (EGFPCAMK2A wild‐type, Pro212Gln, and Pro235Leu) and mClover2‐tagged CAMK2B (mClover2‐CAMK2B wild‐type, Pro213Leu and Arg284Ser). (C) Quantification of p‐CaMKII signals. Each signal was normalized to the GFP signal, and fold changes of the normalized signals compared with wild‐type are shown. *P < 0.05 by ANOVA followed by Dunnett's post hoc test. Bars represent means ± SD.
Figure 6
Figure 6
The Pro212Gln mutant of CaMKII α accelerates the downstroke of the initial AP in hippocampal neurons. (A) Representative traces of single APs evoked by 2–5 msec current injections in neurons transfected with empty vector (empty) and those with the vector encoding wild‐type (WT) or Pro212Gln (P212Q) mutant of CaMKII α. Duration of current injection was adjusted so that injected currents did not overlap the upstrokes of APs. The upstrokes were superimposed to highlight differences in speed of the following downstroke. (B) Representative traces of repetitive AP firing evoked by a 500 msec current injection of three times the rheobase amplitude. (C) Comparisons of the half‐width and the maximum speed of downstroke of single APs evoked by 2–5 msec current injections, and the input resistance and the rheobase of neurons. The numbers in brackets indicate those of neurons analyzed, which are the same in all the graphs in (C) and (D). Input resistance was measured from membrane voltage changes induced by 500 msec hyperpolarizing and depolarizing current injections in 10 or 20 pA increments from the resting membrane voltage. Resistance was determined as the linear regression slope of peak voltage changes against injected currents in the voltage range below the firing threshold and above −80 mV. Rheobase was determined by applying 500 msec depolarizing current injections in 10 or 20 pA increments from the resting membrane voltage. Symbols indicate the measured values in individual neurons, and thick lines with error bars indicate means ± SEMs. *< 0.01 compared with empty and WT by Dunnett's T3 for input resistance and by REGW‐F for others. (D) Changes in minimum interspike voltage level, maximum speed of downstroke, and interspike interval during repetitive firing evoked by a 500 msec current injection of three times the rheobase, and changes in the number of AP spikes during the current injection with increasing current magnitude (the magnitude was a multiple of rheobase). Symbols with error bars indicate means ± SEMs. *< 0.01 compared with empty and WT by REGW‐F for interspike voltage and by Dunnett's T3 for downstroke. NS; not significant.
Figure 7
Figure 7
The Pro212Gln mutant of CaMKII α upregulates IA in hippocampal neurons. (A) Representative traces of total Kv currents (a) and the currents from which IA was separated with a 60 msec pre‐pulse to −10 mV (b). Thus (a–b) yielded the separated IA. Diagrams of voltage pulse protocols are shown above. 200 ms voltage steps were applied in 10 mV increments. (B) Current–voltage relationships of I A (upper) and other Kv currents (lower). The numbers in brackets indicate those of neurons analyzed, which are the same in all the graphs in (B–E). #< 0.01 compared with empty and WT, *< 0.01 compared with WT by REGW‐F. The half‐maximal activation voltage of IA, estimated by fitting the relationship in each neuron with the product of the Boltzmann equation and the Goldman–Hodgkin–Katz current equation, was −26.1 ± 0.8 mV in empty, −26.8 ± 0.7 mV in WT and −26.9 ± 0.9 mV in P212Q, respectively. (C) Comparison of inactivation time constants (τ) of IA. Current decay was fitted with single or double exponentials, and the faster τs were plotted when fitted with double exponentials. (D) A representative current trace elicited by a pair of double voltage pulses to −10 mV applied at a 100 msec interval. Double‐headed arrows indicate the measured amplitudes as I A. (E) Comparisons of I A evoked by the 1st and 2nd voltage pulses and their ratios (2nd/1st). #< 0.01 compared with empty and WT by REGW‐F.

References

    1. Liu XB, Murray KD. Neuronal excitability and calcium/calmodulin‐dependent protein kinase type II: location, location, location. Epilepsia 2012;53(Suppl 1):45–52. - PubMed
    1. Hell JW. CaMKII: claiming center stage in postsynaptic function and organization. Neuron 2014;81:249–265. - PMC - PubMed
    1. Stratton MM, Chao LH, Schulman H, Kuriyan J. Structural studies on the regulation of Ca2+ /calmodulin dependent protein kinase II. Curr Opin Struct Biol 2013;23:292–301. - PMC - PubMed
    1. Yang E, Schulman H. Structural examination of autoregulation of multifunctional calcium/calmodulin‐dependent protein kinase II. J Biol Chem 1999;274:26199–26208. - PubMed
    1. Wayman GA, Tokumitsu H, Davare MA, Soderling TR. Analysis of CaM‐kinase signaling in cells. Cell Calcium 2011;50:1–8. - PMC - PubMed