. 2018 Feb 1;4(1):e00513.
doi: 10.1016/j.heliyon.2018.e00513. eCollection 2018 Jan.

CD4 T cells react to local increase of α-synuclein in a pathology-associated variant-dependent manner and modify brain microglia in absence of brain pathology

Affiliations

CD4 T cells react to local increase of α-synuclein in a pathology-associated variant-dependent manner and modify brain microglia in absence of brain pathology

Mads N Olesen et al. Heliyon. .

Abstract

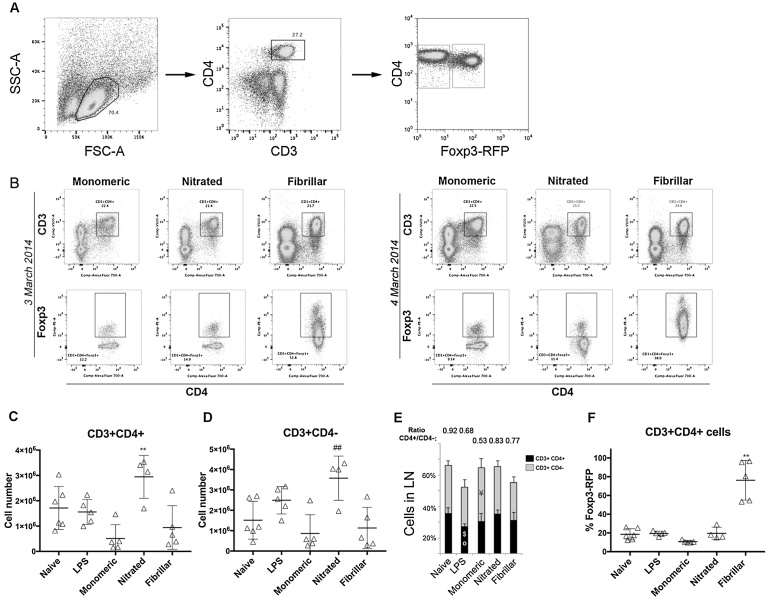
We have previously shown that immunological processes in the brain during α-synuclein-induced neurodegeneration vary depending on the presence or absence of cell death. This suggests that the immune system is able to react differently to the different stages of α-synuclein pathology. However, it was unclear whether these immune changes were governed by brain processes or by a direct immune response to α-synuclein modifications. We have herein locally increased the peripheral concentration of α-synuclein or its pathology-associated variants, nitrated or fibrillar, to characterize the modulation of the CD4 T cell pool by α-synuclein and brain microglia in the absence of any α-synuclein brain pathology. We observed that α-synuclein changed the CD4:CD8 ratio by contracting the CD3+CD4+ T cell pool and reducing the pool of memory Regulatory T cells (Treg). Nitrated α-synuclein induced the expansion of both the CD3+CD4+ and CD3+CD4- T cells, while fibrils increased the percentage of Foxp3+ Treg cells and induced anti-α-synuclein antibodies. Furthermore, the activation pattern of CD3+CD4+ T cells was modulated in a variant-dependent manner; while nitrated and fibrillar α-synuclein expanded the fraction of activated Treg, all three α-synuclein variants reduced the expression levels of STAT3, CD25 and CD127 on CD3+CD4+ T cells. Additionally, while monomeric α-synuclein increased CD103 expression, the fibrils decreased it, and CCR6 expression was decreased by nitrated and fibrillar α-synuclein, indicating that α-synuclein variants affect the homing and tolerance capacities of CD3+CD4+ T cells. Indeed, this correlated with changes in brain microglia phenotype, as determined by FACS analysis, in an α-synuclein variant-specific manner and coincided in time with CD4+ T cell infiltration into brain parenchyma. We have shown that the peripheral immune system is able to sense and react specifically to changes in the local concentration and structure of α-synuclein, which results in variant-specific T cell migration into the brain. This may have a specific repercussion for brain microglia.

Keywords: Immunology; Neuroscience.


Figures

Fig. 1
Fig. 1
Characterization of the nitration of α-syn. MS/MS spectra representing the fragmentation of the Glu34-Lys42 precursor ion. The spectra of the generated product ions were extracted from the Mascot software. Spectra show that Tyr39 is indeed nitrated in the derivatized α-syn sample (A) whereas the peptide encompassing Tyr125, 133, and 136 was found unmodified in the derivatized sample (B).
Fig. 2
Fig. 2
T cell numbers in lymph nodes. Lymph node cells were analyzed by flow cytometry. A. Representative dot plot of the size vs. granularity of our sample which enabled us to gate live cells as it is well established the size and granularity of lymphocytes, and thus one can discard those too big, too small or with granules. The events within this gate where then plotted for CD3 and CD4 expression, those double positive (CD3+CD4+, upper right gate) are CD4+ T cells and those CD3+CD4− are assumed CD8+ T cells, as CD3 (TCR co-receptor) is only expressed in T lymphocytes. The CD3+CD4+ gated fraction was further plotted for CD4 vs. Foxp3+, and CD4+Foxp4+ gated to determine the percentage of regulatory T cells in our sample (Treg, upper-right gate). The percentage of effector cells was determined by gating on the CD4+Foxp3− population (Th, lower-right gate). The percentage given in each gate, represent the number of cells positive for a given combination of markers within the parent population, that is, the previous gate. B. Representative dot plots from two independent experiments showing CD4+Foxp3+ gated cells. C. Total number of CD3+CD4+ and D. Total number of CD3+CD4− cells (grey). E. Percentage of CD4+ (black) and CD4− cells (grey) in lymph nodes. F. Percentage of CD3+CD4+Foxp3+ cells within the total CD3+CD4+ cell population. Average ± SD shown as a grey bar in C–E. One-way ANOVA followed by Tukey HSD, p < 0.05. * Different from all; # different from the other α-syn variants; ° different from naïve; $ different from nitrated; ¥ different from fibrillar. All numbers in the bar graphs are average + SD (3–4 independent experiments were conducted with n = 2–3 per group, after which all data was pooled to obtain a total n = 8–10 per group).
Fig. 3
Fig. 3
IL-2Rα (CD25) and IL-7Rα (CD127) expression on CD3+CD4+ lymph node cells. Cells were gated for CD3+CD4+Foxp3− (i.e. Th) and CD3+CD4+Foxp3+ (i.e. Treg) as in Fig. 1. The gated events for Th and Treg where then plotted in a histogram to determine the percentage and level of expression of IL-2Rα (CD25) and IL-7Rα (CD127) in each population. Lack of CD25 or CD127 expression was determined by gating for the same population in a sampled where the antibody against CD25 or CD127 was omitted (FMO, not shown). All signal above this threshold is considered positive, and is gated to determine the percentage of CD25+ or CD127+ cells within the parent population (i.e. CD3+CD4+Foxp3+CD25+). Representative histograms showing the level of expression of IL-2Rα (A) and IL-7Rα (D) in Th (blue) and Treg (red) T cell populations. Graphs showing the average of cells expressing IL-2Rα (B & C) or IL-7Rα (E & F); grey bar is the average value ± SD. B & E are CD3+CD4+Foxp3− cells and C & F are CD3+CD4+Foxp3+ cells. G Representative dot plots of CD3+CD4+Foxp3+ cells expressing CD127 and CCR6. On the left, a semicolor dot plot that the allow us to see how many events are present, and on the right zebra dot plot to see where the boundaries of the different populations are. One-way ANOVA followed by Tukey HSD, p < 0.05. * Different from all; # different from the other α-syn variants; ° different from naïve; † different from LPS; § different from monomeric (3–4 independent experiments were conducted (n = 2–3 per group), after which all data was pooled to obtain a total n = 8–10 per group).
Fig. 4
Fig. 4
T cell differentiation. A: Actual ELISA data depicted to demonstrate calculation of serum anti-α-syn IgG concentration from absorbance. Standard curve (grey filled circles) is shown diluted from 1:1000 to 1:128;000. The linear range is indicated by a dashed line (dilution 1:2000 to 1:48,000). Color symbols show dilution series from experimental groups, and colored dashed lines indicate the conversion from absorbance to the corresponding antibody concentration. Functional detection limit is indicated (black arrow). Note that samples from animals inoculated with fibrillar α-syn were used at 1:3200 dilution instead of 1:400 due to higher antibody concentration. B Graph showing the average ± SD concentration of anti-α-syn antibodies in serum (μg/μl). All samples were done in duplicates (n = 4/group). C Lymph nodes cells were incubated in vitro for 6 h without activation and thereafter lysed for analysis by SDS-PAGE. Representative blots for each protein studied. Band intensity was quantified and normalized to the intensity of β-actin. D–E Graphs showing the average relative value ± SD of normalized levels of protein in lymph node cell lysates (n = 3–5 samples/group). One-way ANOVA followed by Tukey HSD, p < 0.05. * Different from all; ° different from naïve; † different from LPS.
Fig. 5
Fig. 5
Dopamine receptor D2 and D3 expression on CD3+CD4+ cells. Th and Treg were gated as before, and the percentage of cells positive for dopamine receptor DR-D2 and DR-D3 were determined. A Representative dot plots for a sample with no staining for DR (FM-DR-D2 and DR-D3, left plot) and for two samples co-stained for DR-D2 and DR-D3 (center and right plots). The relative percentages of the different populations are shown as scatter graphs: Double negative (DR−D2−D3−; B & F), DR−D2+ (C & G), DR−D3+ (D & H) and double positive (DR−D2+D3+; E & I) cells within the Th (B–E) and Treg (F–I). The average value is shown as a grey bar ± SD. J. Representative dot plots showing CD3+CD4+Foxp3+ cells gated for DRs. Left dot-plot, a sample with no staining for CCR6 and CD103 (FM-CCR6 and CD103), right dot plot a sample co-stained for CCR6 and CD103. One-way ANOVA followed by Tukey HSD, p < 0.05. ° Different from naïve; ¥ different from fibrillar (3–4 independent experiments were conducted (n = 2–3 per group), after which all data was pooled to obtain a total n = 8–10 per group).
Fig. 6
Fig. 6
Percentage of microglia expressing activation markers. (A) Representative dot plots showing the gating strategy for live CD11b+ cells. Bar graphs representing the average percentage + SD of microglia expressing activation markers related to tolerance (B) or adaptive immunity (C). One-way ANOVA followed by Tukey HSD, p < 0.05. ° Different from naïve; • different from all α-syn variants; † different from LPS; ¥ different from fibrillar α-syn (3–4 independent experiments were conducted (n = 2–3 per group), after which all data was pooled to obtain a total n = 8–10 per group).
Fig. 7
Fig. 7
CD11b immunopositive microglia in striatum, hippocampus, and substantia nigra. A series of coronal brain sections were immunostained with anti-CD11b antibody to assess changes in microglia cell number and/or morphology. Photos show representative images of microglia morphology in substantia nigra (A, D, G, J), striatum (B, E, H, K), and hippocampus (C, F, I, L) of animals having received monomeric α-syn (A-C), nitrated α-syn (D–F), or fibrillar α-syn (G–I), and from a naïve mouse (J–L). Two main types of microglia were found in brain: resting/surveillant type A microglia (small cell bodies with 2–3 thin ramifications and few secondary ones, arrows) and the hyper-ramified type B (cells with numerous secondary and tertiary ramifications that sometimes appeared thicker and often with bigger cytoplasm, arrowheads). Animals receiving nitrated or monomeric α-syn exhibited a greater number of hyper-ramified CD11b+ (type B, arrowheads) cells in substantia nigra (A & D) and striatum (B & E) than naïve animals, which showed mostly type A resting/surveillant microglia (arrows) (J & K). The animals receiving fibrillar α-syn showed type A as the main CD11b+ cell type (G & H). In hippocampus all animal showed Type B CD11b+ cells (arrow, C, F, I & L) as numerous as type A (not shown) Scale bar in A applies to all: 20 μm (n = 2, one experiment).
Fig. 8
Fig. 8
α-syn brain immunostaining. Representative substantia nigra photomicrographs from two different monomeric α-syn animals stained for anti-human α-syn (A & B). A’, A” and B’ show magnification of blood vessels with α-syn+ cells co-stained with cresyl violet to see the cellular environment. Scale bar: B = 100 μm, and A” = 10 μm.
Fig. 9
Fig. 9
CD4+ and IgG+ cells in brain parenchyma. Representative brain photomicrographs of a mouse inoculated with monomeric α-syn stained for CD4 (A–C). (A) A round CD4+ cell in parenchyma. (B) A CD4+ microglia-like cell in association with a blood vessel. (C) A CD4+ microglia-like cell in touch with small round CD4+ cells (arrowheads). Scale bar: 10 μm, applies to all. Representative photomicrographs of brain sections stained for mouse IgG (D–J): In striatum (D–F) and substantia nigra (SN, G–I), from mice receiving monomeric α-syn (D & G), nitrated α-syn (E & H), or fibrillar α-syn (F & I). BV, blood vessel; black arrowhead, positive cell in parenchyma; white arrowhead, positive cell in a blood vessel; squares are magnified in D’ and G’. (D’) Small, ramified IgG+ cells. (G’) Small, round IgG+ cell. (J) Representative photomicrograph of a brain section from the monomeric α-syn group stained for mouse-IgG showing IgG+ blood vessels. Scale bar in (H) (100 μm) applies to (D–J); in (G’) (10 μm) applies to (D’ & G’).

Similar articles

Cited by

References

    1. Almeida A.R., Legrand N., Papiernik M., Freitas A.A. Homeostasis of peripheral CD4+ T cells: IL-2R alpha and IL-2 shape a population of regulatory cells that controls CD4+ T cell numbers. J. Immunol. 2002;169(9):4850–4860. - PubMed
    1. Almeida A.R., Zaragoza B., Freitas A.A. Indexation as a novel mechanism of lymphocyte homeostasis: the number of CD4+CD25+ regulatory T cells is indexed to the number of IL-2-producing cells. J. Immunol. 2006;177(1):192–200. - PubMed
    1. Baba Y., Kuroiwa A., Uitti R.J., Wszolek Z.K., Yamada T. Alterations of T-lymphocyte populations in Parkinson disease. Parkinsonism Relat. Disord. 2005;11(8):493–498. - PubMed
    1. Bae E.J., Ho D.H., Park E., Jung J.W., Cho K., Hong J.H., Lee S.J. Lipid peroxidation product 4-hydroxy-2-nonenal promotes seeding-capable oligomer formation and cell-to-cell transfer of alpha-synuclein. Antioxid. Redox Signal. 2013;18(7):770–783. - PMC - PubMed
    1. Bae E.J., Lee H.J., Rockenstein E., Ho D.H., Park E.B., Yang N.Y., Lee S.J. Antibody-aided clearance of extracellular alpha-synuclein prevents cell-to-cell aggregate transmission. J. Neurosci. 2012;32(39):13454–13469. - PMC - PubMed