. 2018 Aug;21(11):2065-2078.
doi: 10.1017/S1368980018000472. Epub 2018 Mar 21.

Prioritization of the essentials in the spending patterns of Canadian households experiencing food insecurity

Affiliations

Prioritization of the essentials in the spending patterns of Canadian households experiencing food insecurity

Andrée-Anne Fafard St-Germain et al. Public Health Nutr. 2018 Aug.

Abstract

Objective: Food insecurity is a potent determinant of health and indicator of material deprivation in many affluent countries. Food insecurity is associated with compromises in food and housing expenditures, but how it relates to other expenditures is unknown. The present study described households' resource allocation over a 12-month period by food insecurity status.

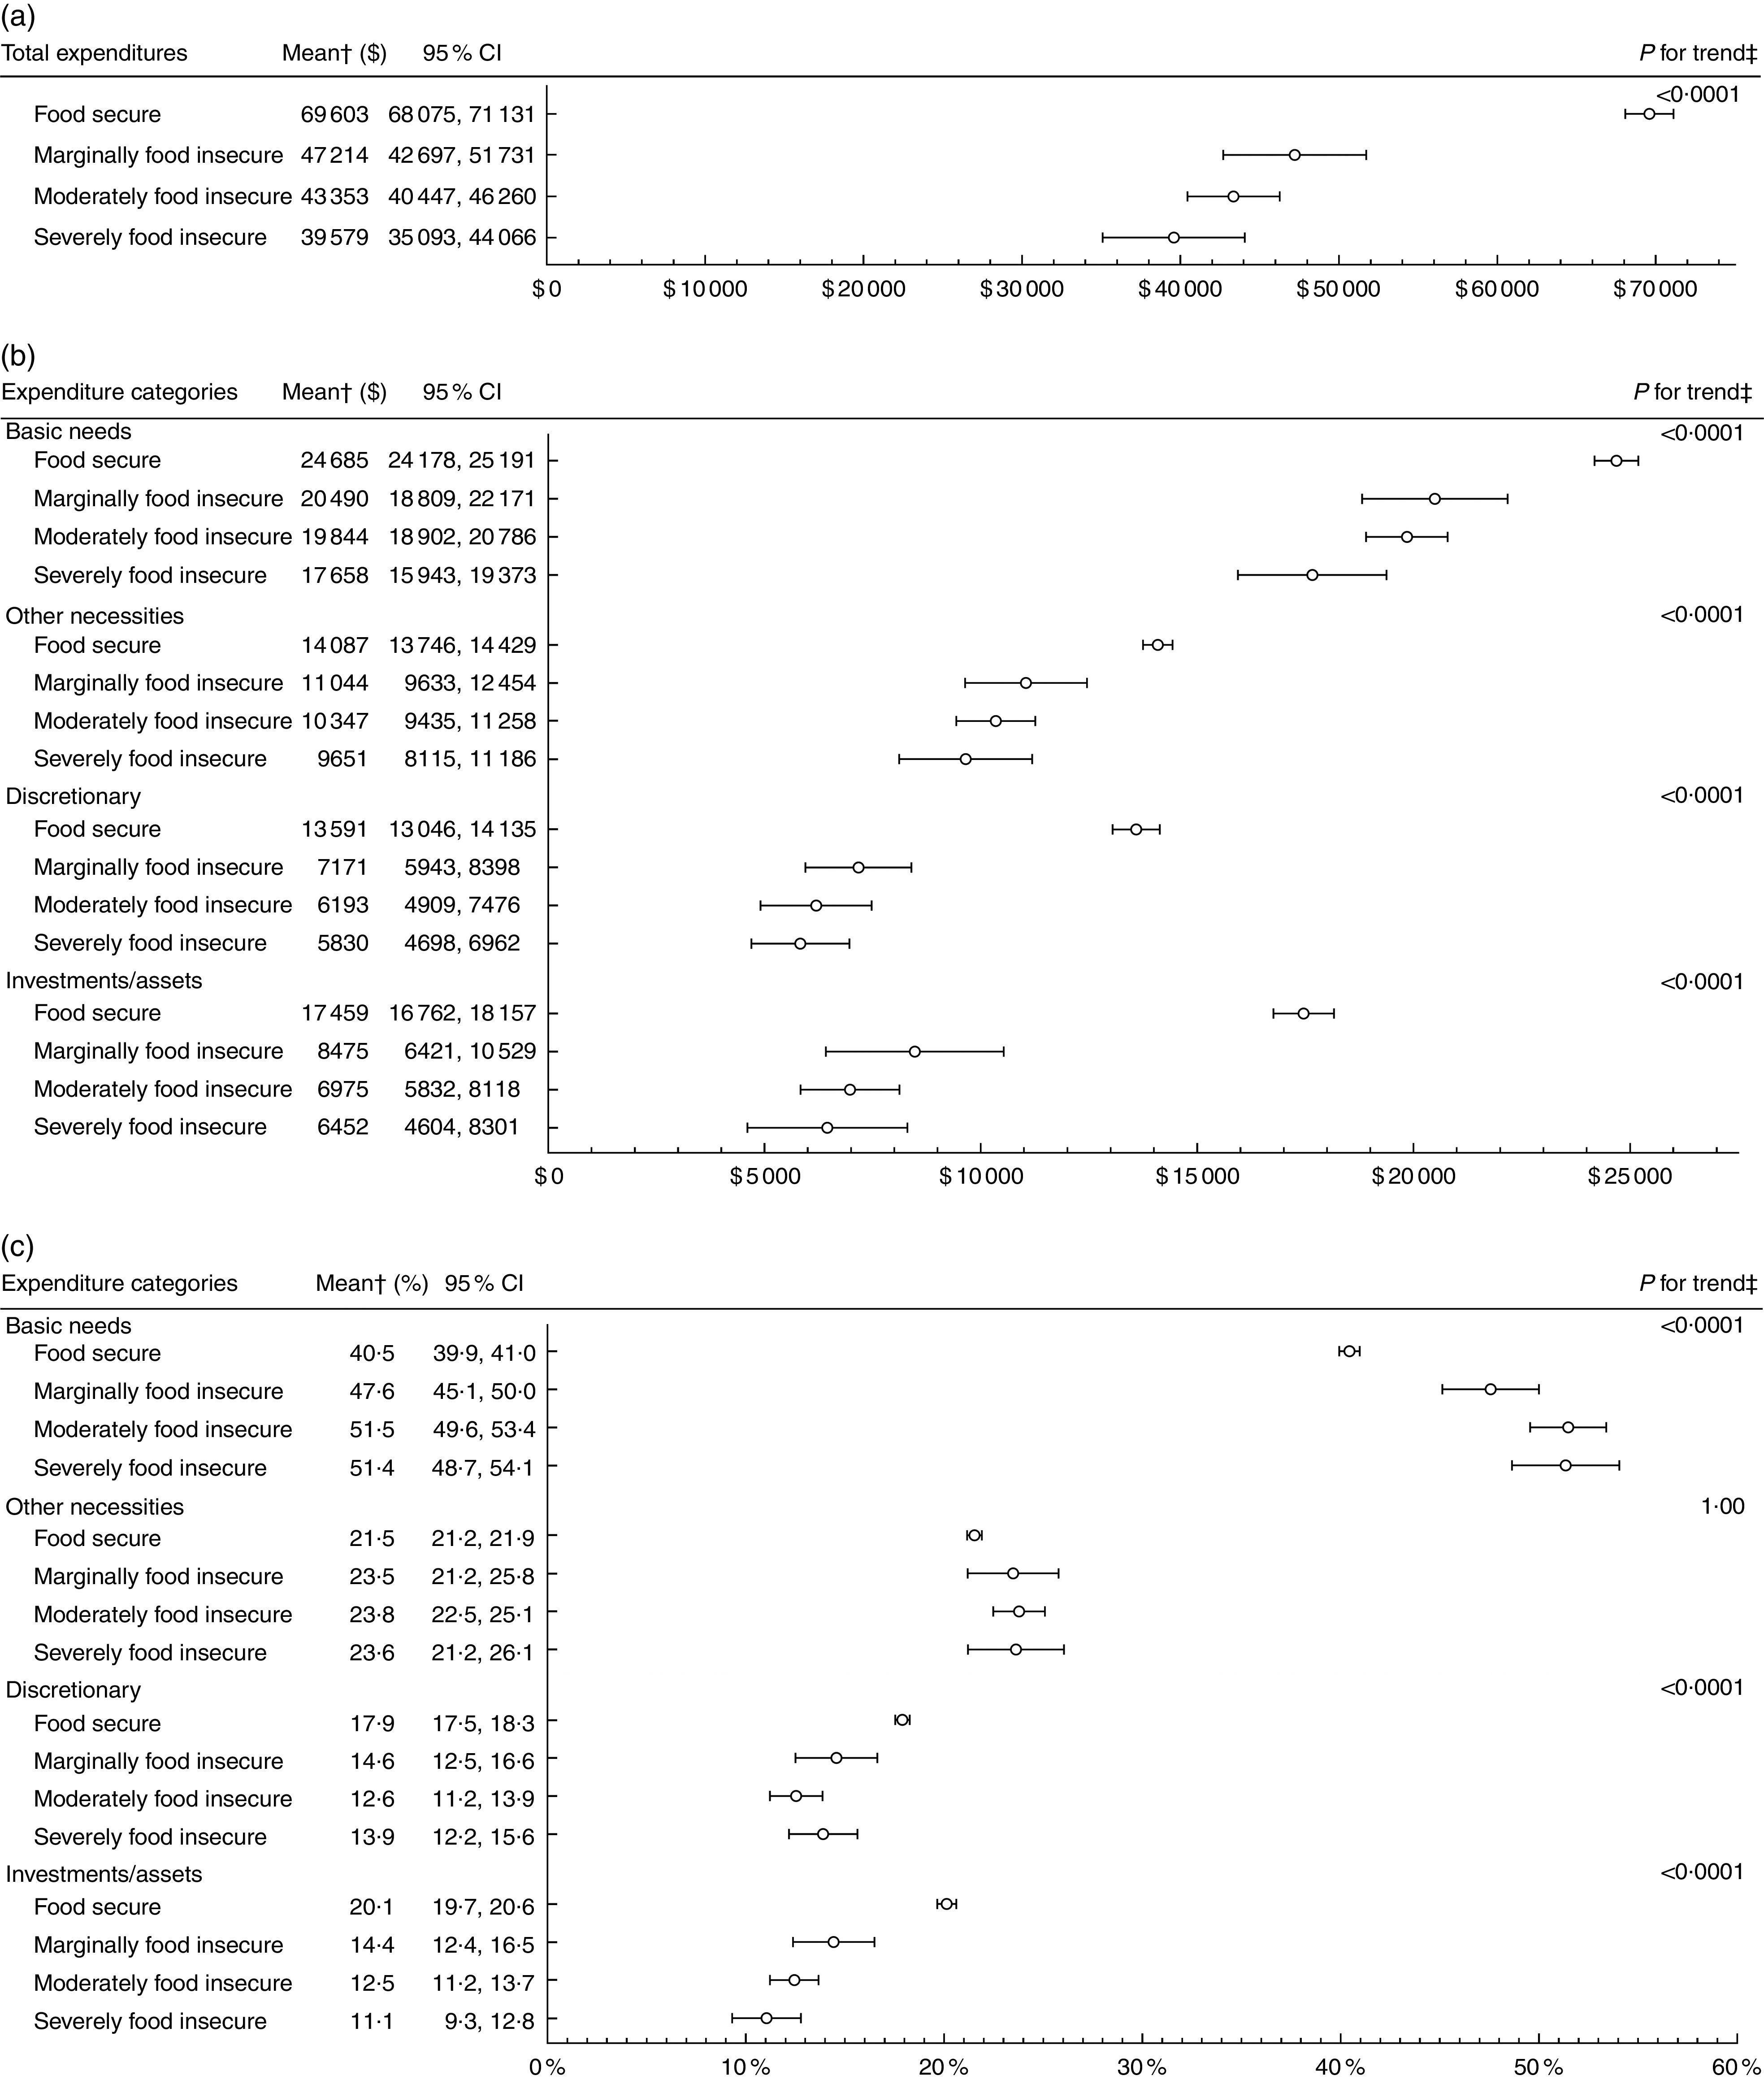
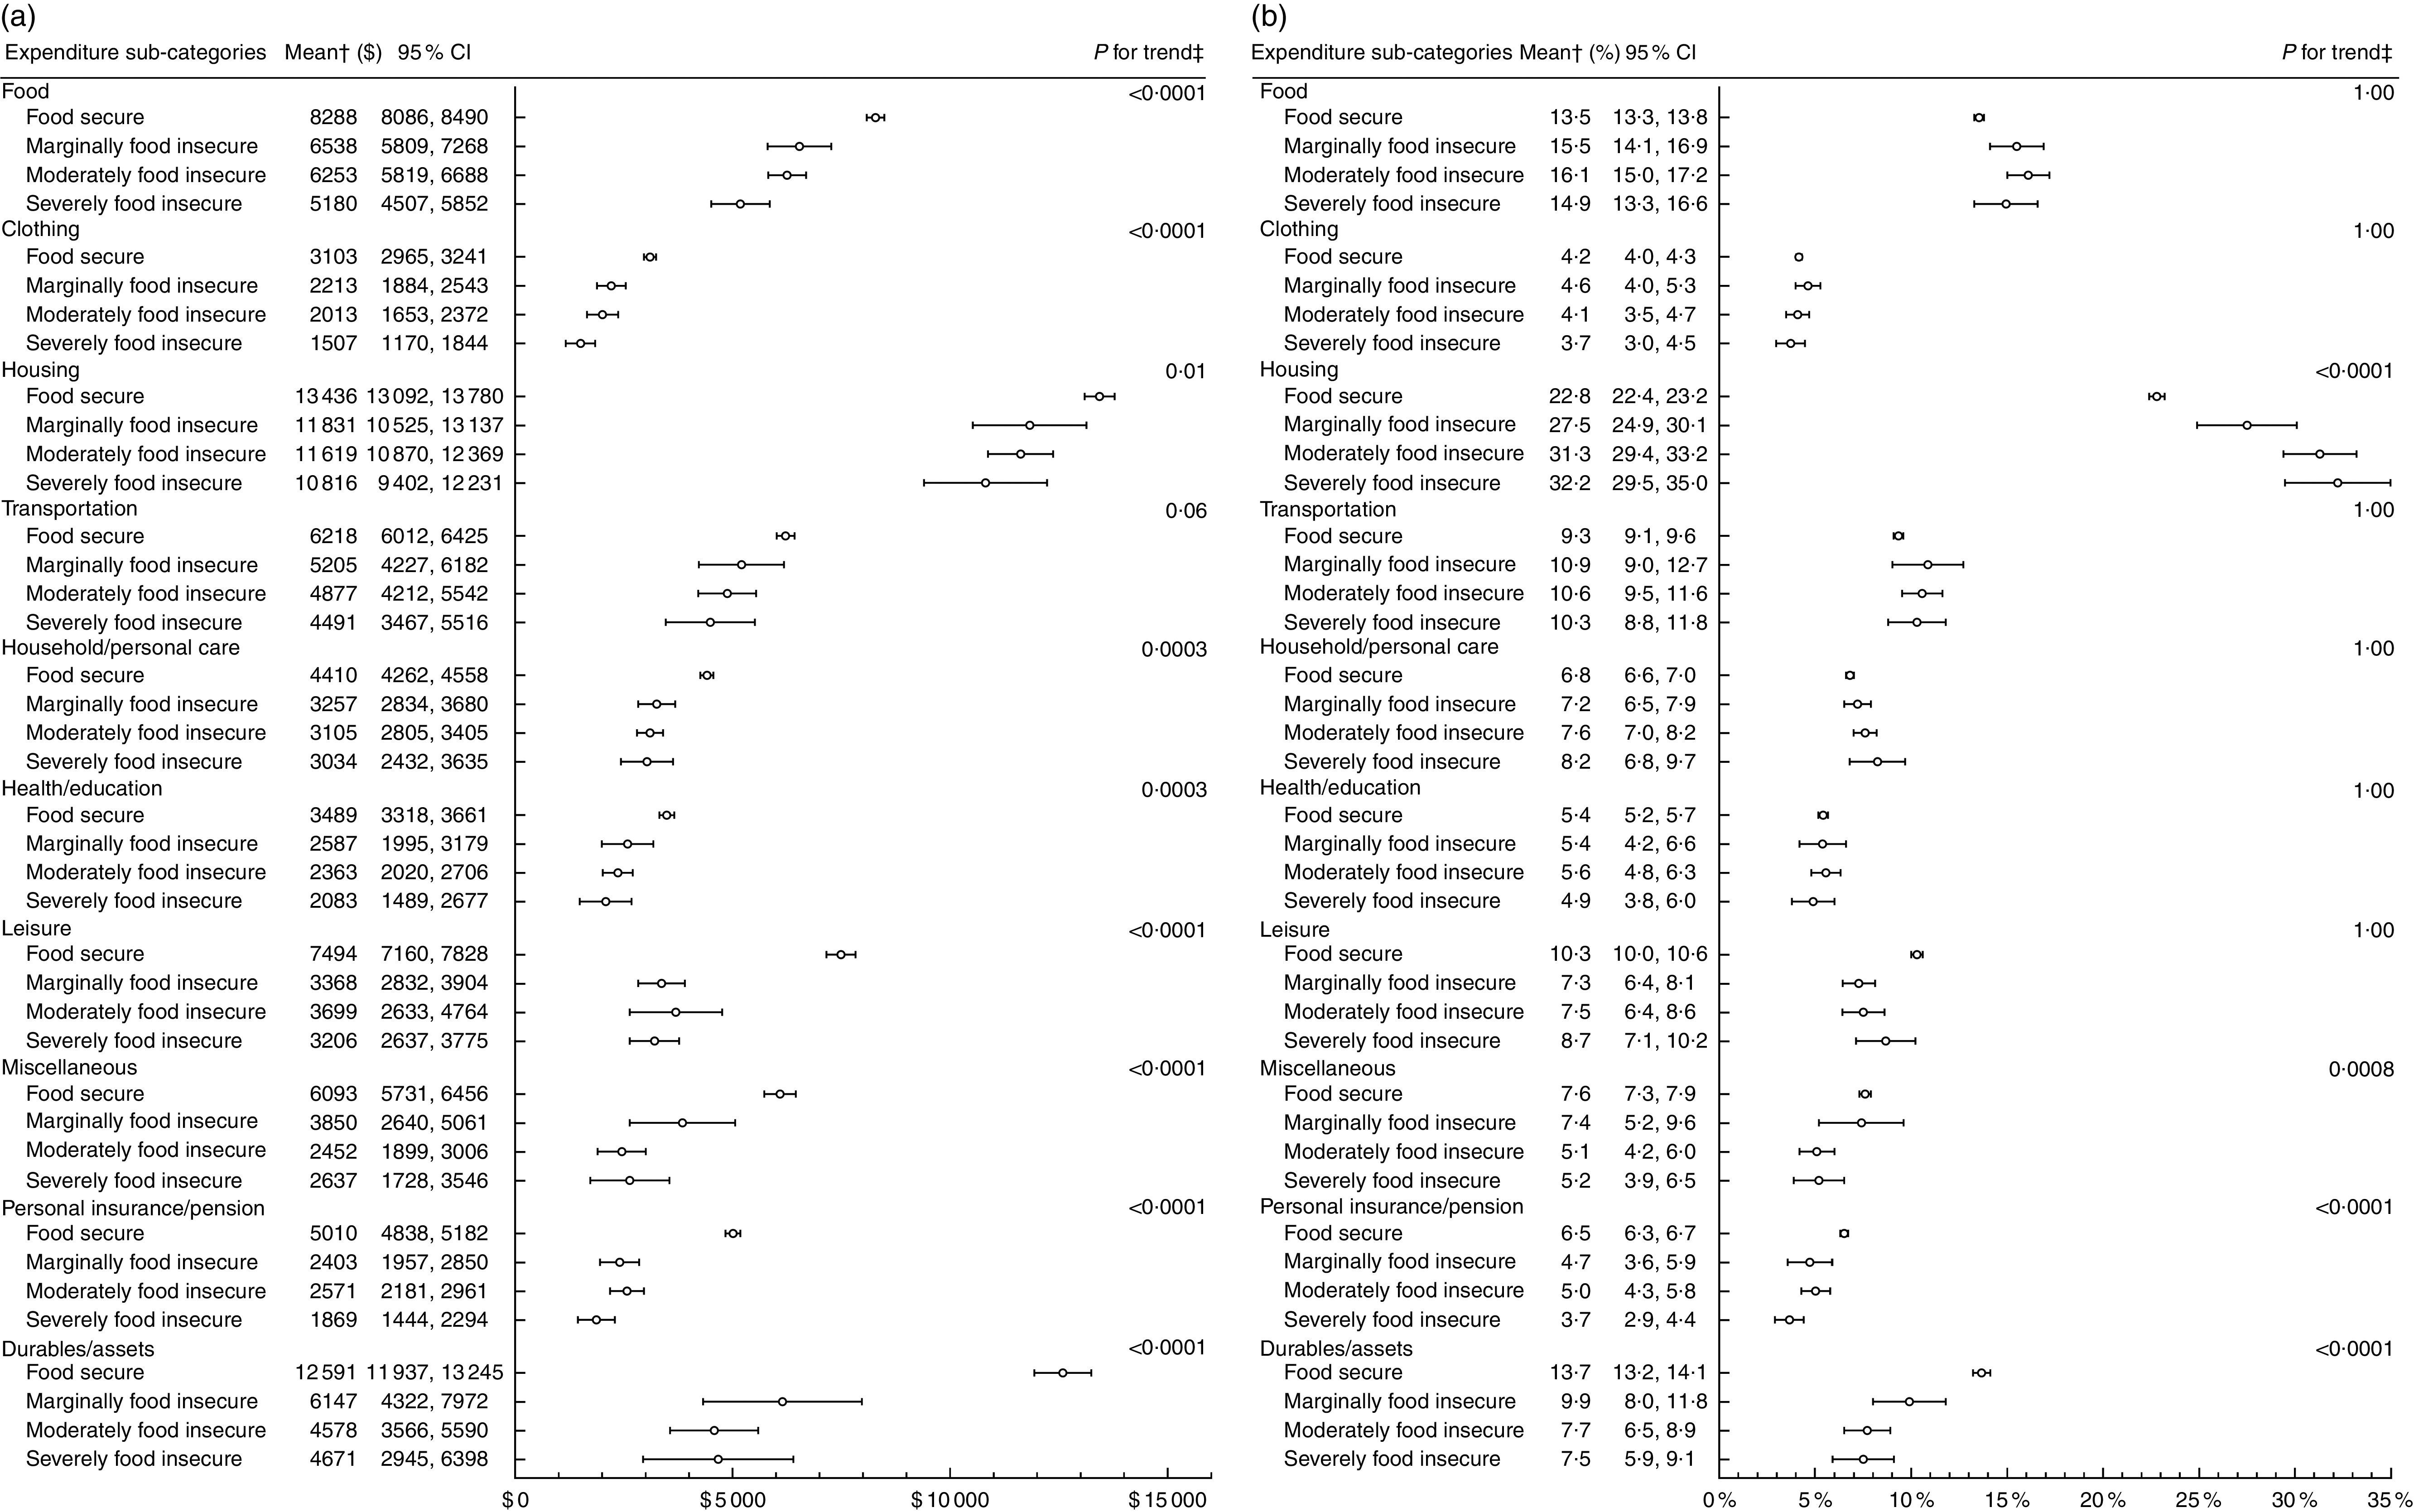
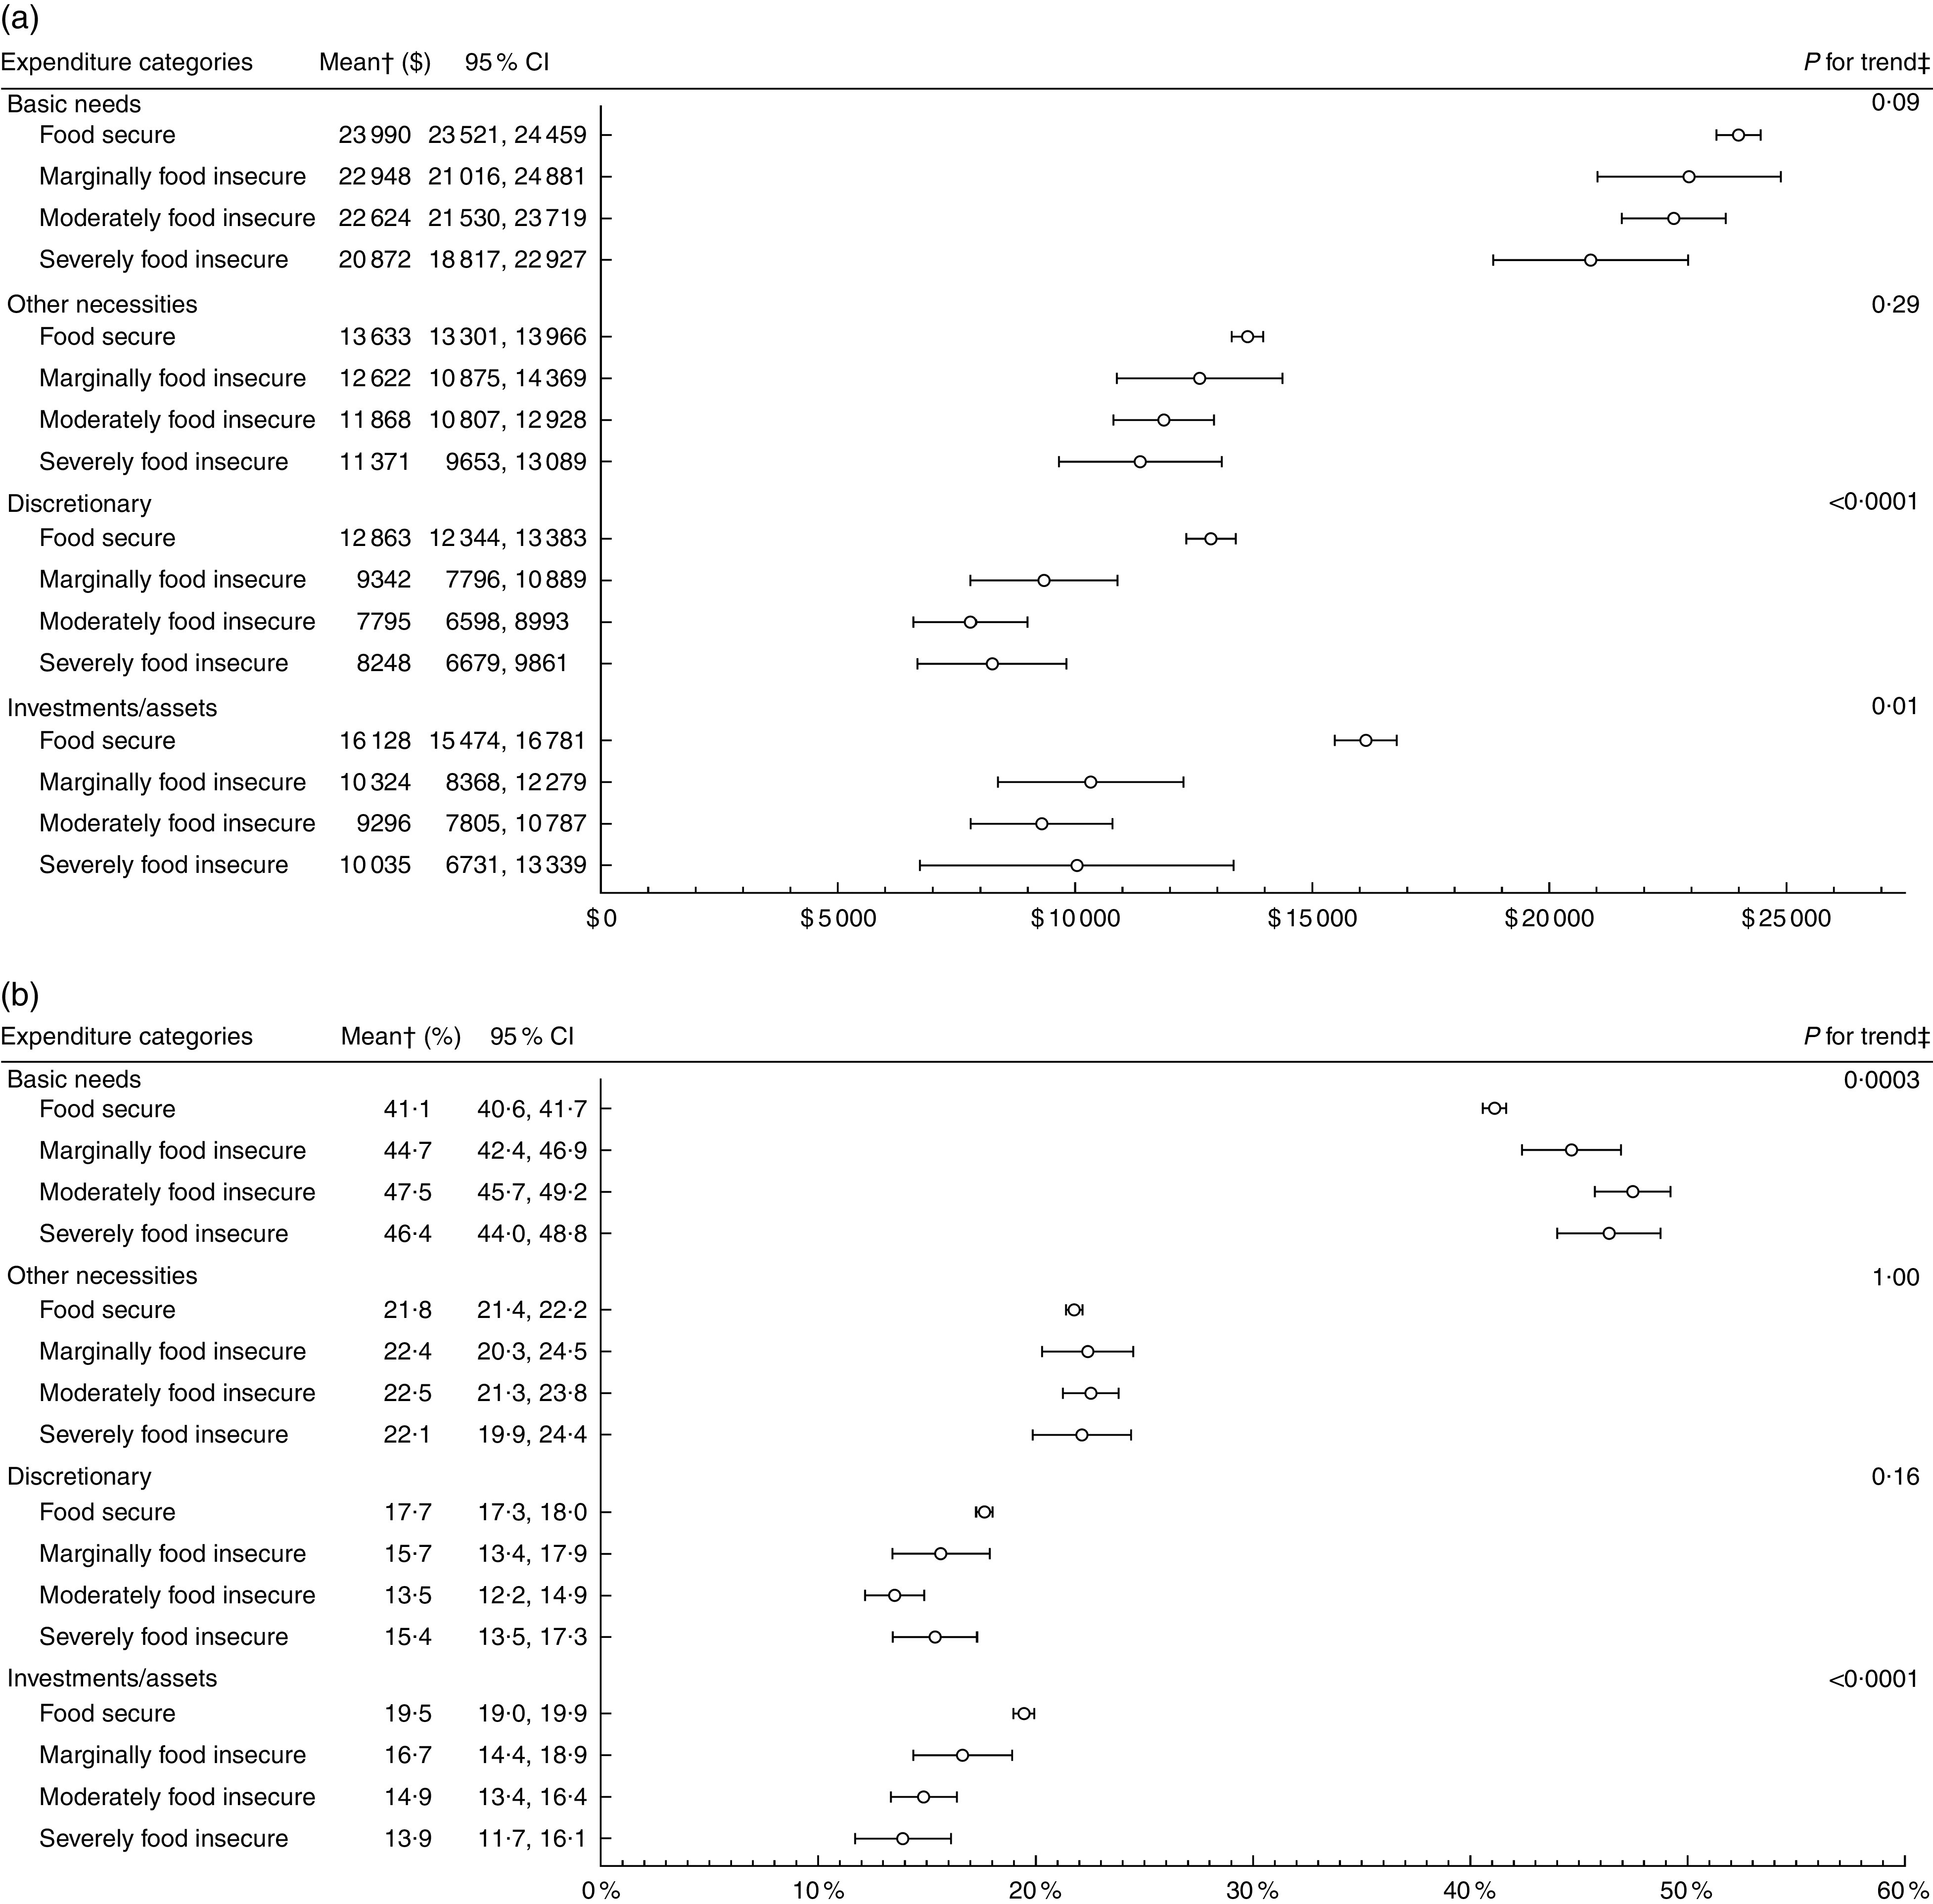
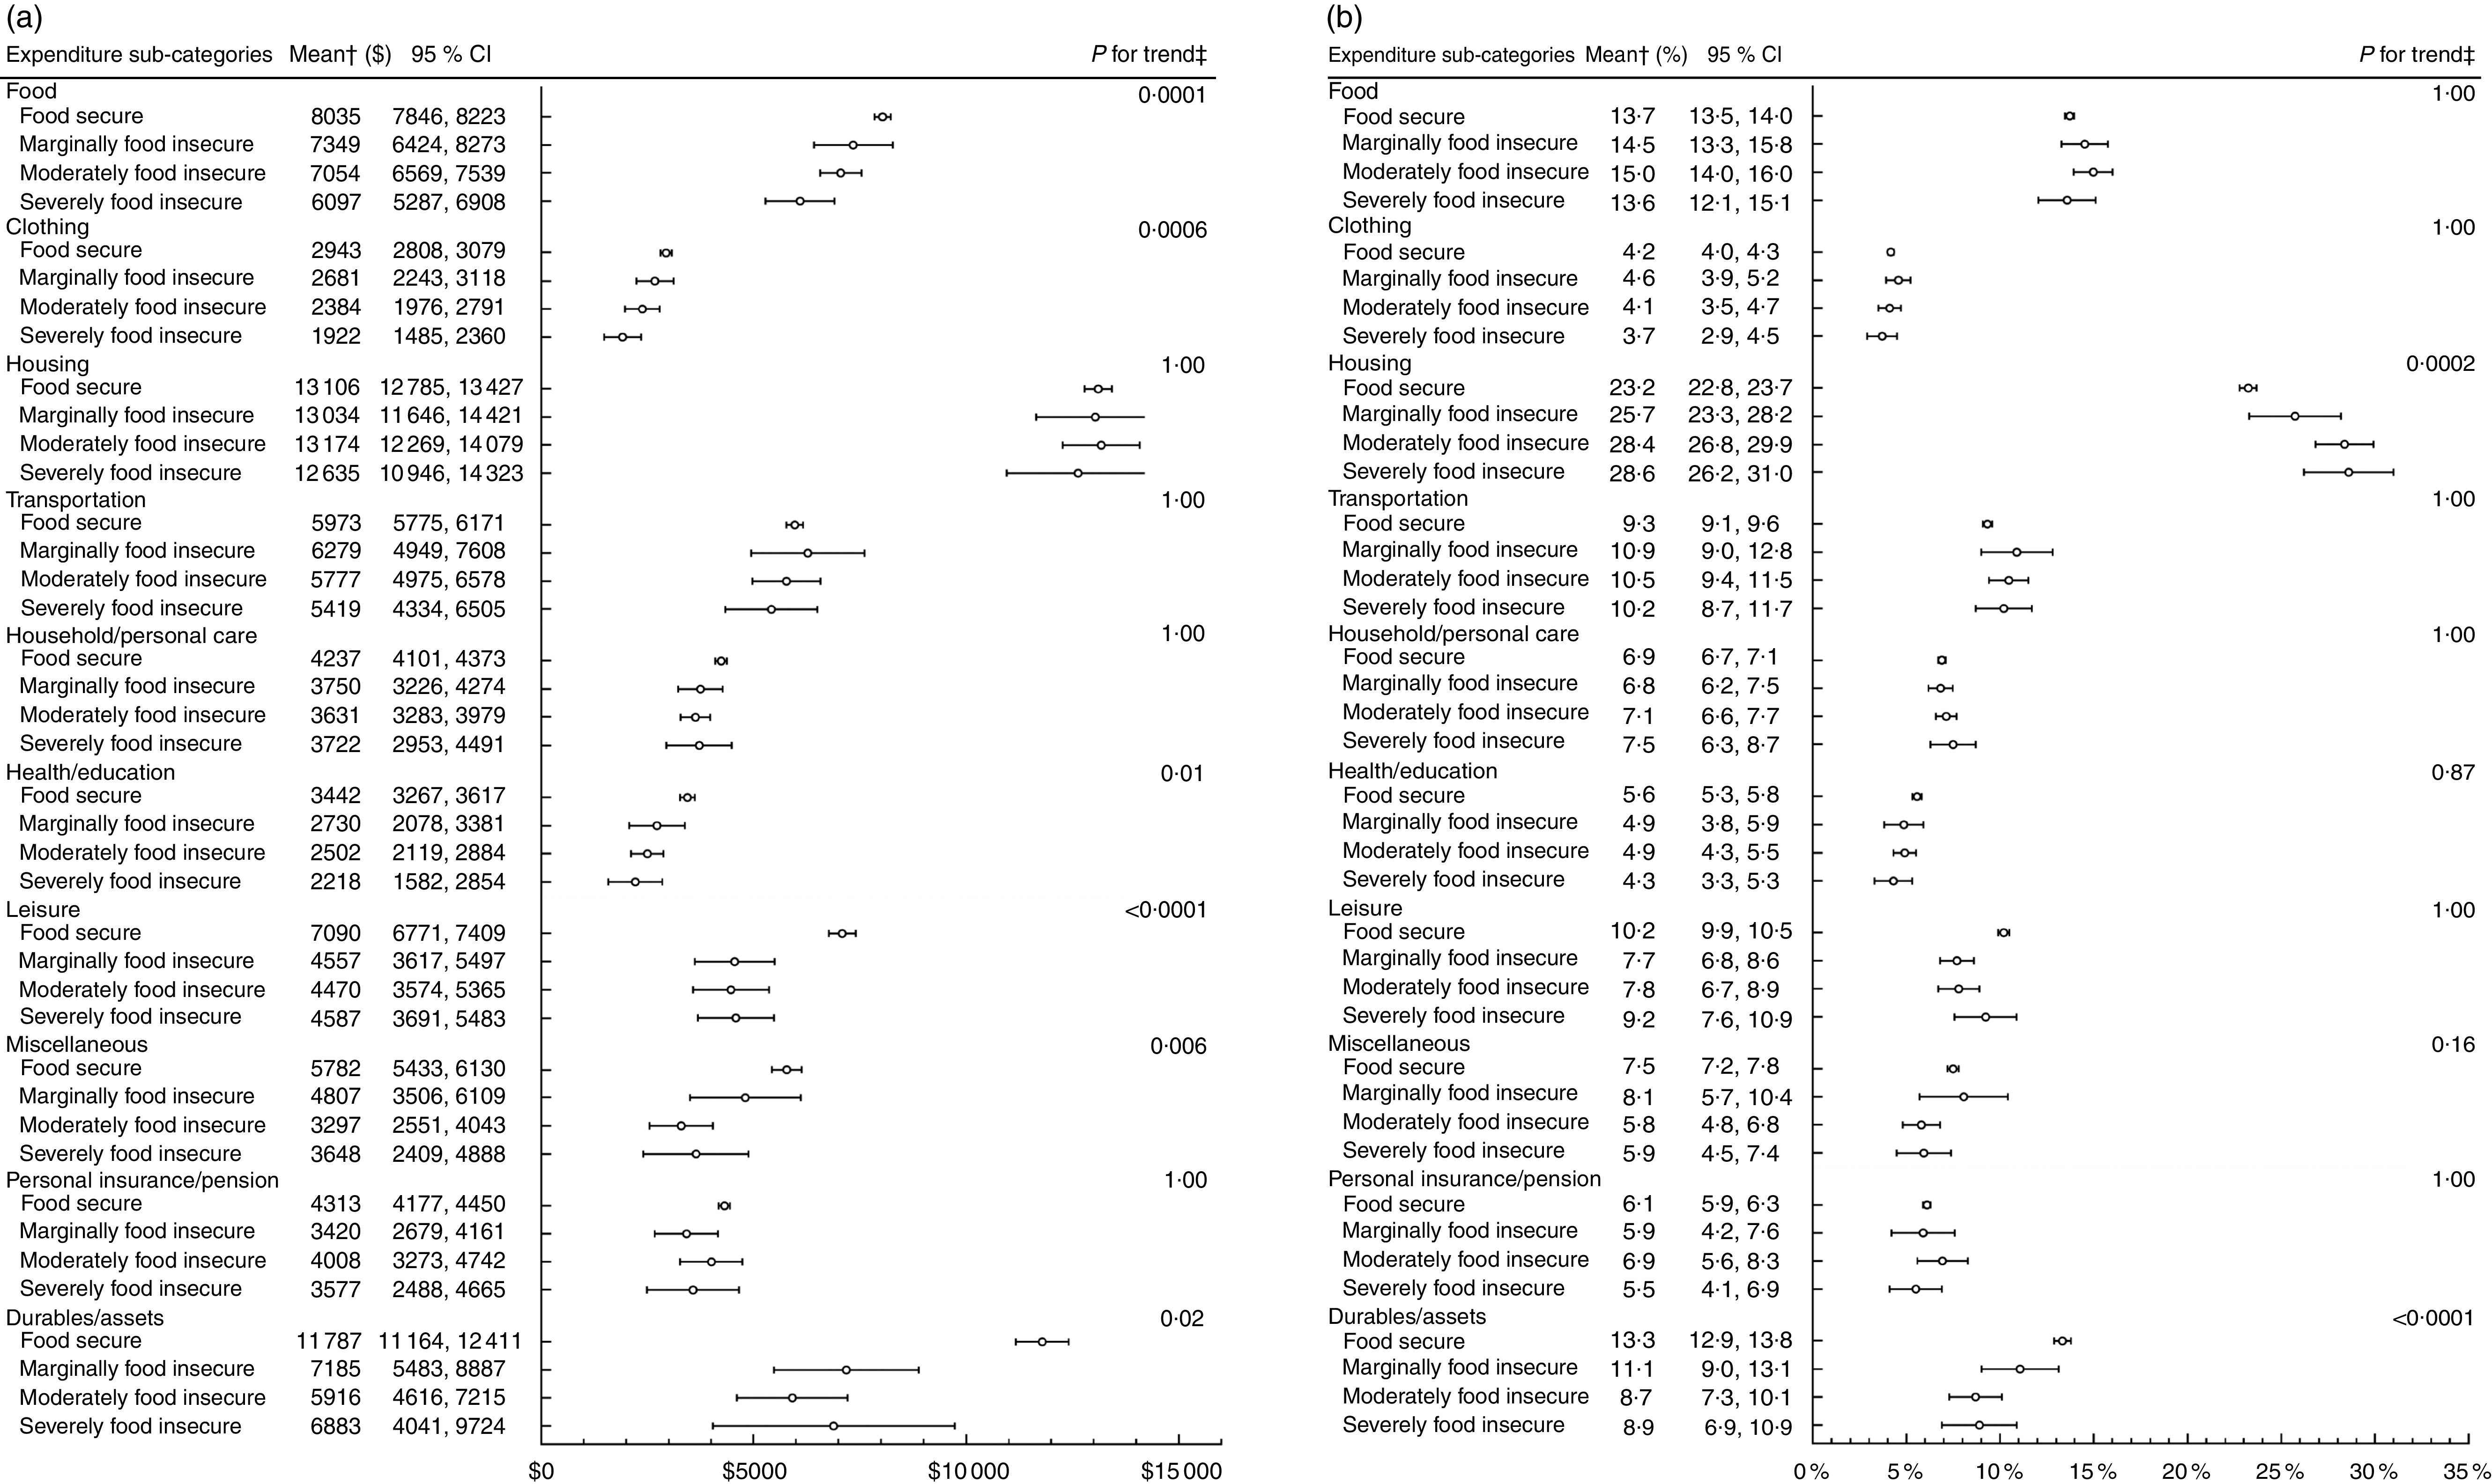
Design: Expenditure data from the 2010 Survey of Household Spending were aggregated into four categories (basic needs, other necessities, discretionary, investments/assets) and ten sub-categories (food, clothing, housing, transportation, household/personal care, health/education, leisure, miscellaneous, personal insurance/pension, durables/assets). A four-level food insecurity status was created using the adult-specific items of the Household Food Security Survey Module. Mean dollars spent and budget share by food insecurity status were estimated with generalized linear models adjusted first for household size and composition, and subsequently for after-tax income quartiles.

Setting: Canada.

Subjects: Population-based sample of households from the ten provinces (n 9050).

Results: Food-secure households had higher mean total expenditures than marginally, moderately and severely food-insecure households (P-trend <0·0001). As severity of food insecurity increased, households spent less on all categories and sub-categories, except transportation, but they allocated a larger budget share to basic needs and smaller shares to discretionary spending and investments/assets. The downward trends for dollars spent on basic needs and other necessities became non-significant after accounting for income, but the upward trend in the budget shares for basic needs persisted.

Conclusions: The spending patterns of food-insecure households suggest that they prioritized essential needs above all else.

Keywords: Basic needs; Canada; Expenditures; Household food insecurity; Spending patterns.


Figures

Fig. 1
Fig. 1
Mean total expenditures by household food insecurity status* (a), mean dollars spent in each expenditure category by household food insecurity status* (b) and mean budget share allocated to each expenditure category by household food insecurity status* (c) in a population-based sample of households from the ten provinces of Canada (n 9050), 2010 Survey of Household Spending. All dollar values are $CAN. *Analyses using all households with no missing food insecurity status; food secure (n 7783), marginally food insecure (n 324), moderately food insecure (n 621) and severely food insecure (n 322). †Predicted means conditional on number of children <18 years, number of adults 18–64 years and number of seniors ≥65 years in the household set at observed values; means (○) and 95 % CI (represented by horizontal bars) estimated while accounting for the complex survey design. ‡Bonferroni-adjusted P value for linear trend test across household food insecurity status; the linear trend test accounted for the complex survey design
Fig. 2
Fig. 2
Mean dollars spent in each expenditure sub-category by household food insecurity status* (a) and mean budget share allocated to each expenditure sub-category by household food insecurity status* (b) in a population-based sample of households from the ten provinces of Canada (n 9050), 2010 Survey of Household Spending. All dollar values are $CAN. *Analyses using all households with no missing food insecurity status; food secure (n 7783), marginally food insecure (n 324), moderately food insecure (n 621) and severely food insecure (n 322). †Predicted means conditional on number of children <18 years, number of adults 18–64 years and number of seniors ≥65 years in the household set at observed values; means (○) and 95 % CI (represented by horizontal bars) estimated while accounting for the complex survey design. ‡Bonferroni-adjusted P value for linear trend test across household food insecurity status; the linear trend test accounted for the complex survey design
Fig. 3
Fig. 3
Mean dollars spent in each expenditure category by household food insecurity status* while controlling for household income (a) and mean budget share allocated to each expenditure category by household food insecurity status* while controlling for household income (b) in a population-based sample of households from the ten provinces of Canada (n 9050), 2010 Survey of Household Spending. All dollar values are $CAN. *Analyses using all households with no missing food insecurity status; food secure (n 7783), marginally food insecure (n 324), moderately food insecure (n 621) and severely food insecure (n 322). †Predicted means conditional on number of children <18 years, number of adults 18–64 years and number of seniors ≥65 years in the household, and quartiles of after-tax household income set at observed values; means (○) and 95 % CI (represented by horizontal bars) estimated while accounting for the complex survey design. ‡Bonferroni-adjusted P value for linear trend test across household food insecurity status; the linear trend test accounted for the complex survey design
Fig. 4
Fig. 4
Mean dollars spent in each expenditure sub-category by household food insecurity status* while controlling for household income (a) and mean budget share allocated to each expenditure sub-category by household food insecurity status* while controlling for household income (b) in a population-based sample of households from the ten provinces of Canada (n 9050), 2010 Survey of Household Spending. All dollar values are $CAN. *Analyses using all households with no missing food insecurity status; food secure (n 7783), marginally food insecure (n 324), moderately food insecure (n 621) and severely food insecure (n 322). †Predicted means conditional on number of children <18 years, number of adults 18–64 years and number of seniors ≥65 years in the household, and quartiles of after-tax household income set at observed values; means (○) and 95 % CI (represented by horizontal bars) estimated while accounting for the complex survey design. ‡Bonferroni-adjusted P value for linear trend test across household food insecurity status; the linear trend test accounted for the complex survey design

References

    1. Tarasuk V, Mitchell A & Dachner N (2016) Household Food Insecurity in Canada, 2014. Toronto, ON: Research to identify policy options to reduce food insecurity; (PROOF).
    1. Gundersen C (2013) Food insecurity is an ongoing national concern. Adv Nutr 4, 36–41. - PMC - PubMed
    1. Ashton JR, Middleton J & Lang T (2014) Open letter to Prime Minister David Cameron on food poverty in the UK. Lancet 383, 1631. - PubMed
    1. Loopstra R, Reeves A & Stuckler D (2015) Rising food insecurity in Europe. Lancet 385, 2041. - PubMed
    1. Gundersen C & Ziliak JP (2015) Food insecurity and health outcomes. Health Aff (Millwood) 34, 1830–1839. - PubMed

Publication types

Grants and funding

LinkOut - more resources