. 2019 Sep;39(9):1725-1736.
doi: 10.1177/0271678X18766743. Epub 2018 Mar 21.

Glucose transporter 2 mediates the hypoglycemia-induced increase in cerebral blood flow

Affiliations

Glucose transporter 2 mediates the hypoglycemia-induced increase in cerebral blood flow

Hongxia Lei et al. J Cereb Blood Flow Metab. 2019 Sep.

Abstract

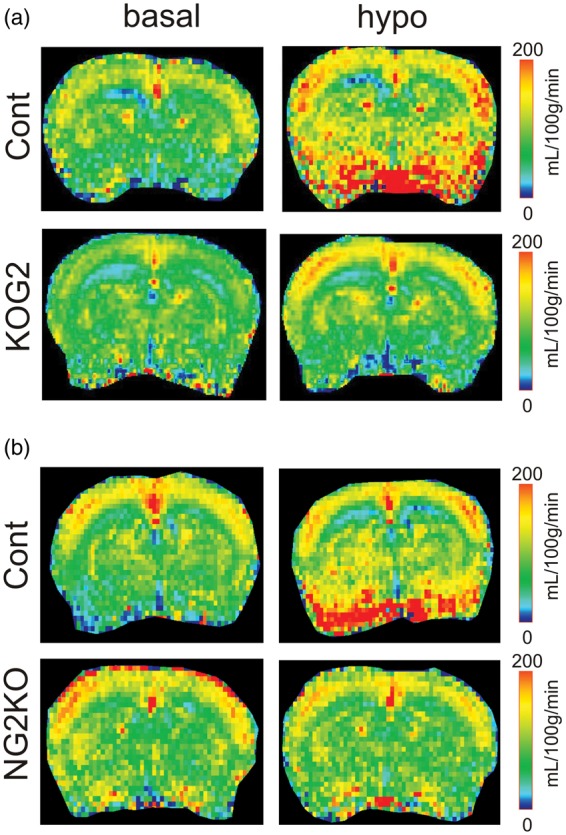
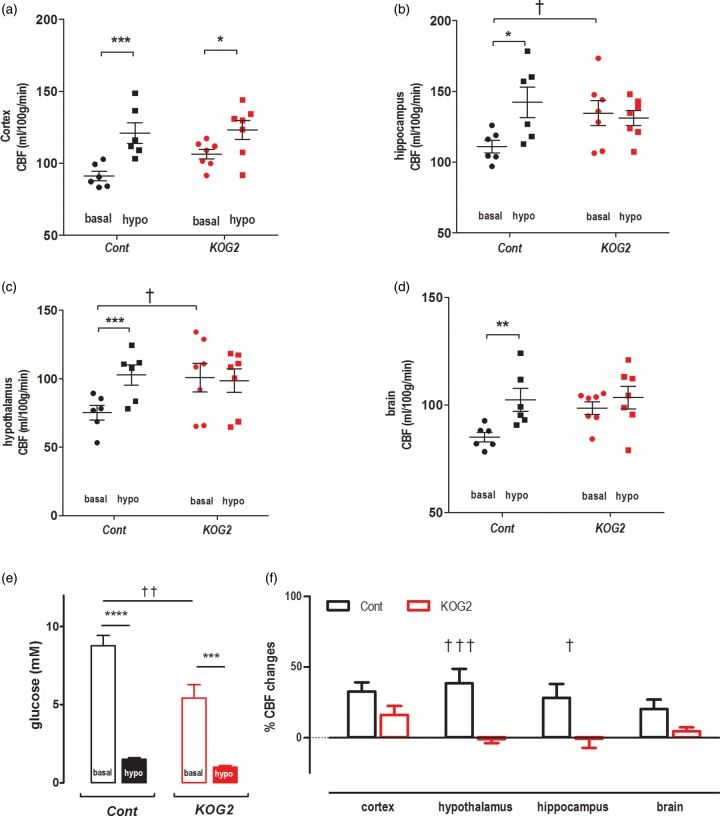
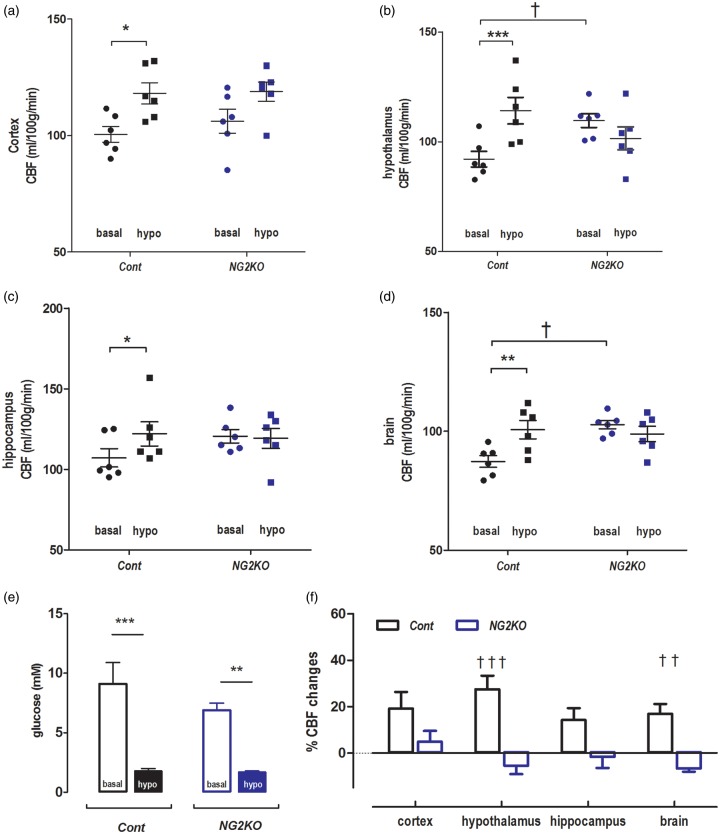
Glucose transporter 2 (Glut2)-positive cells are sparsely distributed in brain and play an important role in the stimulation of glucagon secretion in response to hypoglycemia. We aimed to determine if Glut2-positive cells can influence another response to hypoglycemia, i.e. increased cerebral blood flow (CBF). CBF of adult male mice devoid of Glut2, either globally (ripglut1:glut2-/-) or in the nervous system only (NG2KO), and their respective controls were studied under basal glycemia and insulin-induced hypoglycemia using quantitative perfusion magnetic resonance imaging at 9.4 T. The effect on CBF of optogenetic activation of hypoglycemia responsive Glut2-positive neurons of the paraventricular thalamic area was measured in mice expressing channelrhodopsin2 under the control of the Glut2 promoter. We found that in both ripglut1:glut2-/- mice and NG2KO mice, CBF in basal conditions was higher than in their respective controls and not further activated by hypoglycemia, as measured in the hippocampus, hypothalamus and whole brain. Conversely, optogenetic activation of Glut2-positive cells in the paraventricular thalamic nucleus induced a local increase in CBF similar to that induced by hypoglycemia. Thus, Glut2 expression in the nervous system is required for the control of CBF in response to changes in blood glucose concentrations.

Keywords: Glut2; cerebral blood flow; glut2 brain cells; hypoglycemia; optogenetic.


Figures

Figure 1.
Figure 1.
MR spectra of mouse brain hippocampus and hypothalamus. Localized MR spectra of hippocampus (red voxel in top MR image) and hypothalamus (yellow voxel in bottom MR image). Gln: glutamine; Glu: glutamate; tCr: total creatine; GABA: γ-aminobyutraric acid; myo-Ins: myo-inositol; NAA: N-acetyl-aspartate; Mac: macromolecule; Lac: lactate.
Figure 2.
Figure 2.
Neurochemical profiles of hippocampus and hypothalamus. Neurochemical profiles of hippocampus (Top) and hypothalamus (Bottom) of ripglut1;glut2−/− mice (KOG2, solid black bars, n = 5) and their age-matched controls (Cont, in white bars, n = 5) recorded in the basal state, revealed very minimal changes in ripglut1;glut2−/− (KOG2) mice except a small increase of myo-inositol (myo-Ins, arrow) in hippocampus (genotype: F(1,192) = 20.72, p-value < 0.0001, metabolite: F(23,192) = 957.4, p-value < 0.0001, interaction, F(23,192) = 2.209, p-value = 0.002, Two-way ANOVA followed by the Bonferroni post-tests p-value < 0.01). Ala: alanine; Asc: ascorbate; Asp: aspartate; bHB: beta-hydroxybutryrate; Cr: creatine; myo-Ins: myo-inositol; GABA: γ-aminobutryric acid; Glc: glucose; Gln: Glutamine; Glu: glutamate; Gly: glycine; GPC: glycerophoshocholine; GSH: glutathione; Lac: lactate; Mac: macromolecule; NAA: N-acetyl-aspartate; NAAG: N-acetyl-aspartyl-glutamate; PCho: phosphocholine; PCr: phosphocreatine; PE: phosphatidylethanolamines; Tau: taurine. NAA+NAAG, Glu+Gln, GPC+PCho, Cr+PCr and myo-Ins+Tau were included for statistical analysis but not displayed here. Error bars were SEMs.
Figure 3.
Figure 3.
Cerebral blood flow color maps. Typical CBF maps of ripglut1;glut2−/− mice (KOG2 in a) and NG2KO mice (b) mice and their corresponding control littermates in basal conditions (basal, left column) and during insulin-induced hypoglycemia (hypo, right column). The typical CBF maps (mL/100 g/min) at Bregma 1 mm were scaled in the range of 0–200 ml/100 g/min to colors (see side bars).
Figure 4.
Figure 4.
Impaired activation of CBF in ripglut1; glut2−/− mice during insulin-induced hypoglycemia. The CBF values (ml/100 g/min) of ripglut1; glut2−/− (KOG2) mice and their control littermates (Cont) were measured under basal glycemic condition and insulin-induced hypoglycemia in different brain regions: (a) cortex, (b) hypothalamus, (c) hippocampus and (d) whole brain. (e) Glycemic levels of control and ripglut1; glut2−/− mice under basal glycemic condition and upon insulin-induced hypoglycemia. (f) Changes in CBF in the indicated brain regions of control and ripglut1; glut2−/− mice under insulin-induced hypoglycemia, expressed as percent of basal CBF values. Error bars were SEMs. Statistical significance: *p < 0.05, **p < 0.01, ***p < 0.001, comparing treatments (two-way RM ANOVA with the Bonferroni post-tests), e.g. basal and hypo, in the same genotype groups. †p < 0.05, ††p < 0.01, †††p < 0.001, comparing genotypes, e.g. KOG2 vs. Cont, under the same glycemic conditions (genotype and region factors, two-way ANOVA with the Bonferroni post-tests). When compare basal vs. hypo in the same genotype groups (a–d), two-way RM ANOVA was applied. Cont. treatment: F(1,20) = 52.73, p-value < 0.0001, regions: F(3,20) = 10.81, p-value = 0.0002, interaction: F(3,20) = 0.7462, p-value = 0.5372; K2GO. treatment: F(1,24) = 1.799, p-value = 0.1924, regions: F(3,24) = 6.181, p-value = 0.0029, interaction: F(3,24) = 2.4, p-value = 0.0927. To compare genotype (a–d), two-way ANOVA was applied with genotype and region factors at basal and hypo conditions. Basal: genotype, F(1,44) = 20.01, p-value < 0.0001; region, (F(3,44) = 13.04, p-value < 0.0001; and interaction, F(3,44) = 0.4813, p-value = 0.6970; hypo: genotype, F(1,44) = 0.3470, p-value = 0.5588; region, F(3,44) = 11.12, p-value < 0.0001; interaction, F(3,44) = 0.3573, p-value = 0.7841. In F, genotype: F(1, 44) = 28.71, p-value < 0.0001, region: F(3, 44) = 1.319, p-value = 0.2804, interaction: F(3, 44) = 1.408, p-value = 0.2531.
Figure 5.
Figure 5.
Impaired activation of CBF in NG2KO mice during insulin-induced hypoglycemia. The CBF values (ml/100 g/min) of NG2KO mice (n = 6) and their control littermates (Cont, n = 6) were measured under basal glycemic condition and insulin-induced hypoglycemia in different brain regions: (a) cortex, (b) hypothalamus, (c) hippocampus and (d) whole brain. (e) Glycemic levels of control and NG2KO mice under basal glycemic condition and upon insulin-induced hypoglycemia. (f) Changes in CBF in the indicated brain regions of control and NG2KO mice under insulin-induced hypoglycemia, expressed as percent of basal CBF values. Error bars were SEMs. Statistical significance: *p < 0.05, **p < 0.01, ***p < 0.001, comparing treatments (two-way RM ANOVA with the Bonferroni post-tests), e.g. basal and hypo, in the same genotype groups. †p < 0.05, ††p < 0.01, †††p < 0.001, comparing genotypes, e.g. NG2KO vs. Cont, under the same glycemic conditions (genotype and region factors, two-way ANOVA with the Bonferroni post-tests). To compare basal vs. hypo in the same genotype groups (a–d), two-way RM ANOVA was applied (treatment and region). Cont: treatment, F(1,20) = 79.34, p-value < 0.0001; regions, F(3,20) = 3.862, p-value = 0.0249; interaction, F(3,20) = 1.028, p-value = 0.4013; Subjects (matching) p-value = 0.0002; NG2KO: treatment, F(1,20) = 0.007026, p-value = 0.934; regions, F(3,20) = 4.919, p-value = 0.0102; interaction, F(3,20) = 4.274, p-value = 0.0174; Subjects (matching), p-value = 0.0098. To compare genotype (a–d), two-way ANOVA was applied with genotype and region factors at basal and hypo conditions. Basal: genotype, F(1,40) = 22.61, p-value < 0.0001; region, (F(3,40) = 8.249, p-value = 0.0002; and interaction, F(3,40) = 0.9113, p-value = 0.4442; hypo: genotype, F(1,40) = 1.252, p-value = 0.2698; region, F(3,40) = 6.802, p-value = 0.0008; interaction, F(3,40) = 0.6181, p-value = 0.6074. In F (genotype and region factors), genotype: F(1,40) = 36.43, p-value < 0.0001, interaction: F(3,40) = 2.811, p-value = 0.0516, region: F(3,40) = 1.940, p-value = 0.1387.
Figure 6.
Figure 6.
Optogenetic activation of Glut2 neurons of the PVT increases local CBF. Glut2 neurons of the PVT expressing channelrhodopsin were stimulated by light during CBF measurements. In anatomical MR images (a), squares indicate the location of the PVT. (b) Light-induced CBF increase in mice expressing channelrhodopsin (Glut2-ChR) in Glut2 cells (n = 5) but not in control mice (Cont) not expressing channelrhodopsin (n = 6). Error bars were SEMs. Student unpaired t-test p value was 0.004.

Similar articles

Cited by

References

    1. Attwell D, Buchan AM, Charpak S, et al. Glial and neuronal control of brain blood flow. Nature 2010; 468: 232–243. - PMC - PubMed
    1. Belanger M, Allaman I, Magistretti PJ. Brain energy metabolism: focus on astrocyte-neuron metabolic cooperation. Cell Metab 2011; 14: 724–738. - PubMed
    1. Verberne AJ, Sabetghadam A, Korim WS. Neural pathways that control the glucose counterregulatory response. Front Neurosci 2014; 8: 38. - PMC - PubMed
    1. Bryan RM, Jr, Pelligrino DA. Cerebral blood flow during chronic hypoglycemia in the rat. Brain Res 1988; 475: 397–400. - PubMed
    1. Thomas M, Sherwin RS, Murphy J, et al. Importance of cerebral blood flow to the recognition of and physiological responses to hypoglycemia. Diabetes 1997; 46: 829–833. - PubMed

Publication types

LinkOut - more resources