Nicotinic acid and related compounds: A meta-analysis of their use for hyperphosphatemia in dialysis patients
- PMID: 29561409
- PMCID: PMC5895315
- DOI: 10.1097/MD.0000000000010117
Nicotinic acid and related compounds: A meta-analysis of their use for hyperphosphatemia in dialysis patients
Abstract
Background: Studies indicate that nicotinic acid and related compounds may decrease phosphorus concentrations effectively by reducing the absorption in the gastrointestinal tract. However, the efficacy and safety of oral niacin treatments have only been investigated in a limited number of small-scale studies.
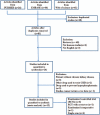
Methods: We performed this meta-analysis by pooling 12 qualified relevant preclinical and clinical trials to evaluate the association of nicotinic acid (and its related compounds) treatment and hyperphosphatemia among dialysis patients. Baseline and after treatment data were collected from the studies to evaluate drug efficacy, effect on lipid profile, and drug safety. To evaluate drug efficacy, subgroups were created based on different exposure time (i.e., 4 wks, 8 wks, 12 wks, and 24 wks) and each subgroup was compared against baseline data. In the assessment of lipid profile and drug safety, results of 8-week treatment were compared against baseline data.
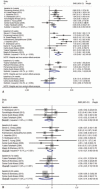
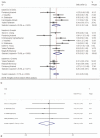
Results: Our study showed that in the efficacy assessment of drug treatment, serum phosphorus concentration was only significantly reduced in the 4-week (SMD, 0.68; 95% CI, 0.40 to 0.97; P = .000; n = 8), and 8-week (SMD, 1.05; 95% CI, 0.68 to 1.42; P = .000; n = 10) treatment groups. The calcium × phosphorus product showed significantly reduced concentration in all the drug exposure time settings, and no rebound was detected (4-wk treatment: SMD, 0.61; 95% CI, 0.18 to 1.04; P = .005; n = 5; 8-wk treatment: SMD, 0.76; 95% CI, 0.32 to 1.18, P = .001; n = 8; and 12-wks treatment: SMD, 0.28, 95% CI, -0.06 to 0.61; P = .103; n = 3). Lipid profile monitoring showed that high-density lipoprotein (HDL) and triglycerides (TG) significantly changed after 8 weeks of treatment (HDL: SMD, -0.63; 95% CI, -1.03 to 0.24; P = .002; n = 5) and TG: SMD, 0.25; 95% CI, 0.02 to 0.49; P = .033; n = 5). Assessment of drug safety detected significant association for incidence of diarrhea (8% incidence rate; 95% CI, 4% to 12%; P = .001) and total adverse event (41% incidence rate, 95% CI: 12% to 69%, P = .001).
Conclusion: Our study concludes that nicotinic acid and related compounds can significantly reduce serum phosphorus concentration with additive antilipemic effects. We also recommend that the safety of this drug be further studied, as our results suggest significant incidence of adverse events.
Conflict of interest statement
The authors declare no conflicts of interest.
Figures


References
-
- Foley RN, Parfrey PS, Sarnak MJ. Clinical epidemiology of cardiovascular disease in chronic renal disease. Am J Kidney Dis 1998;32(5 Suppl 3):S112–9. - PubMed
-
- Six I, Maizel J, Barreto FC, et al. Effects of phosphate on vascular function under normal conditions and influence of the uraemic state. Cardiovasc Res 2012;96:130–9. - PubMed
-
- Kim WY, Lee JB, Kim HY, et al. Achievement of the National Kidney Foundation Kidney Disease Outcomes Quality Initiative: recommended serum calcium, phosphate and parathyroid hormone values with parathyroidectomy in patients with secondary hyperparathyroidism. J Korean Surg Soc 2013;85:25–9. - PMC - PubMed
-
- Block GA, Hulbert-Shearon TE, Levin NW, et al. Association of serum phosphorus and calcium x phosphate product with mortality risk in chronic hemodialysis patients: a national study. Am J Kidney Dis 1998;31:607–17. - PubMed
MeSH terms
Substances
LinkOut - more resources
Full Text Sources
Other Literature Sources
Medical
Miscellaneous

