

The value of 18F-FDG-PET/CT in the diagnosis of solitary pulmonary nodules: A meta-analysis
- PMID: 29561412
- PMCID: PMC5895332
- DOI: 10.1097/MD.0000000000010130
The value of 18F-FDG-PET/CT in the diagnosis of solitary pulmonary nodules: A meta-analysis
Abstract
Background: Solitary pulmonary nodules (SPNs) are common imaging findings. Many studies have indicated that F-fluorodeoxyglucose positron emission tomography/computed tomography (F-FDG-PET/CT) is an accurate test for distinguishing benign and malignant SPNs. The aim of this study was to investigate the value of F-FDG-PET/CT in the diagnosis of malignant SPNs.
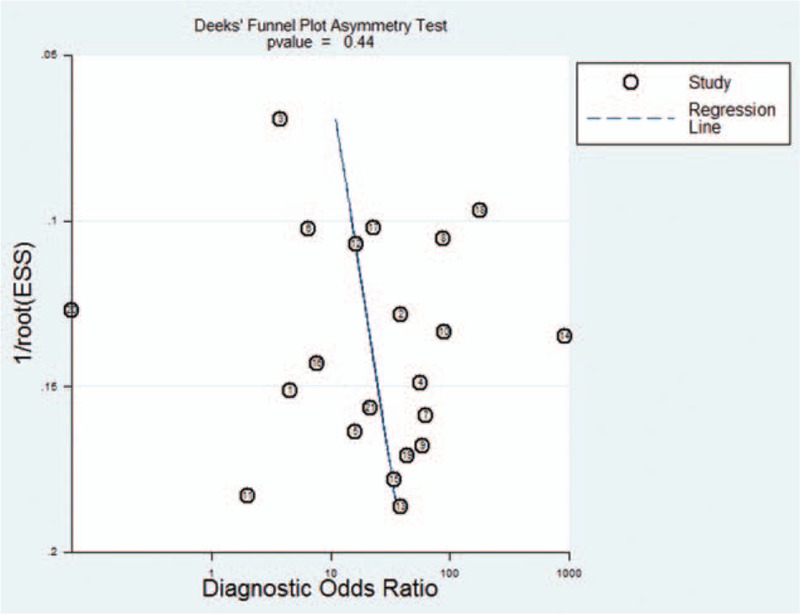
Methods: We systematically searched the PubMed and Embase databases up to March 2017, and published data on sensitivity, specificity, and other measures of diagnostic accuracy of F-FDG-PET/CT in the diagnosis of malignant SPNs were meta-analyzed. Statistical analyses were undertaken using Meta-DiSc 1.4 software and Stata version 12.0. The measures of accuracy of F-FDG-PET/CT in the diagnosis of malignant SPNs were pooled using random-effects models.
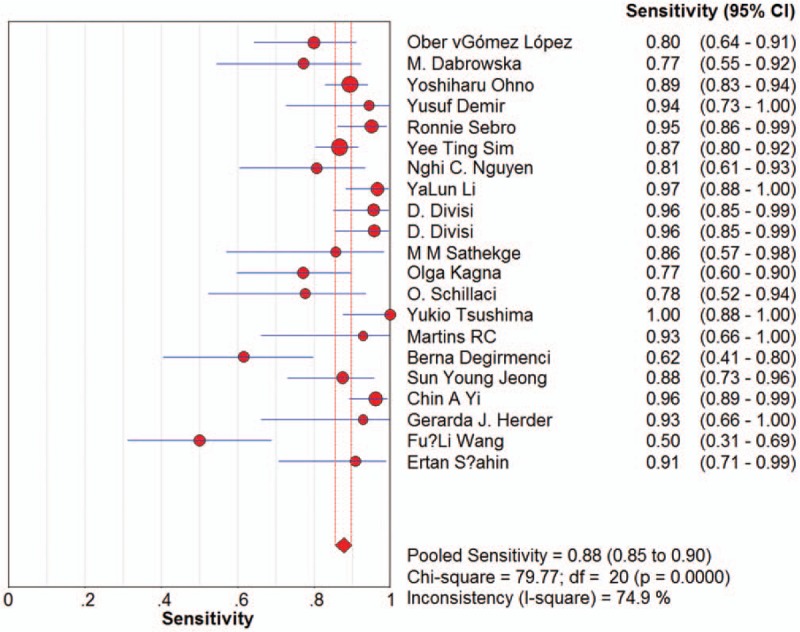
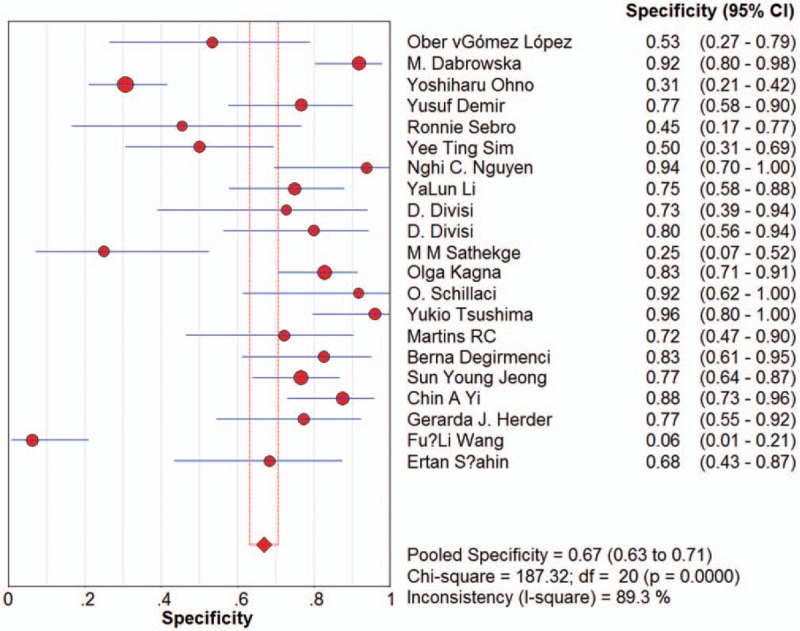
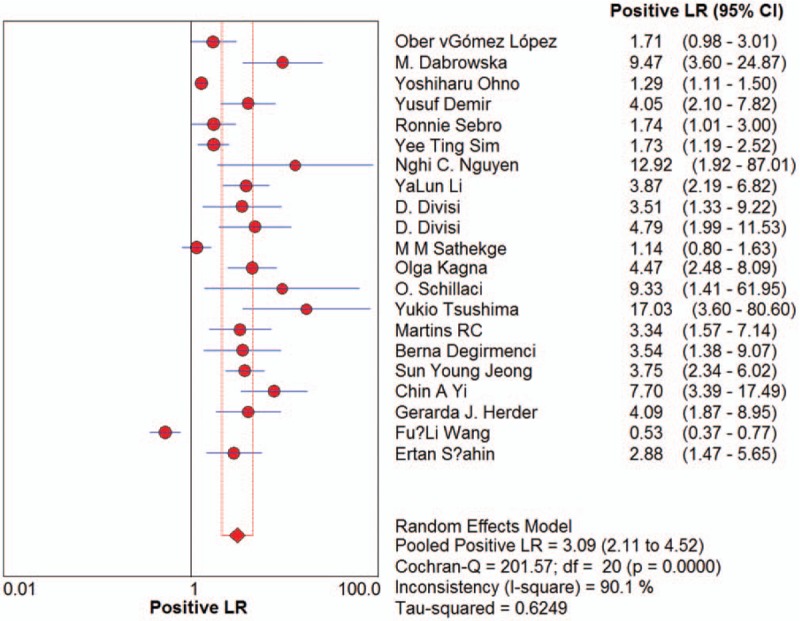
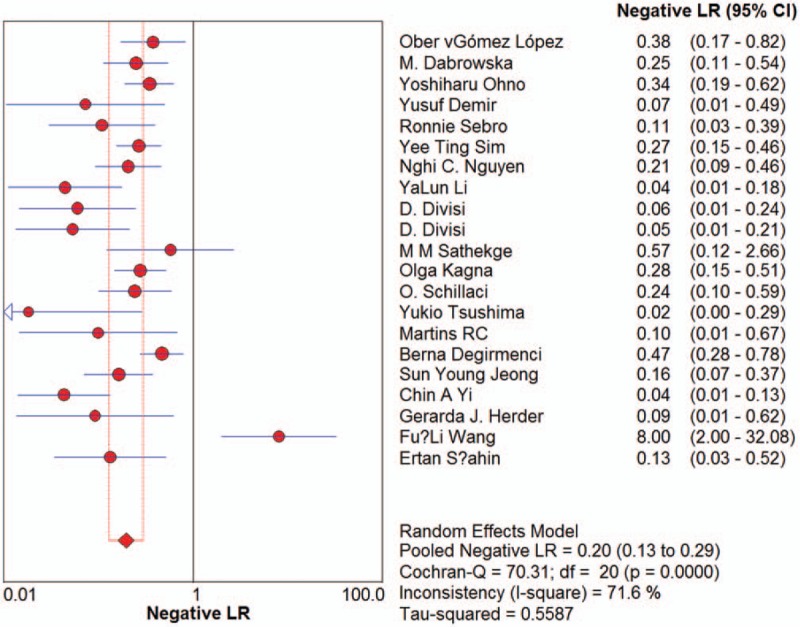
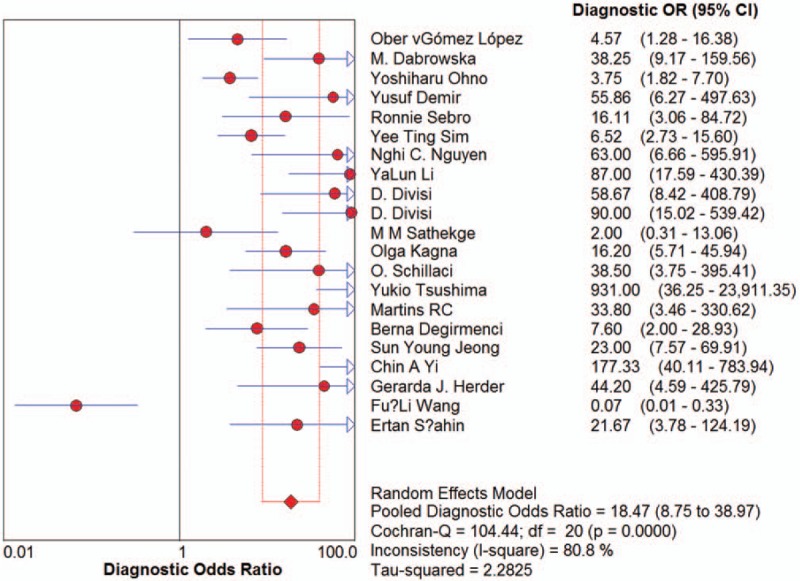
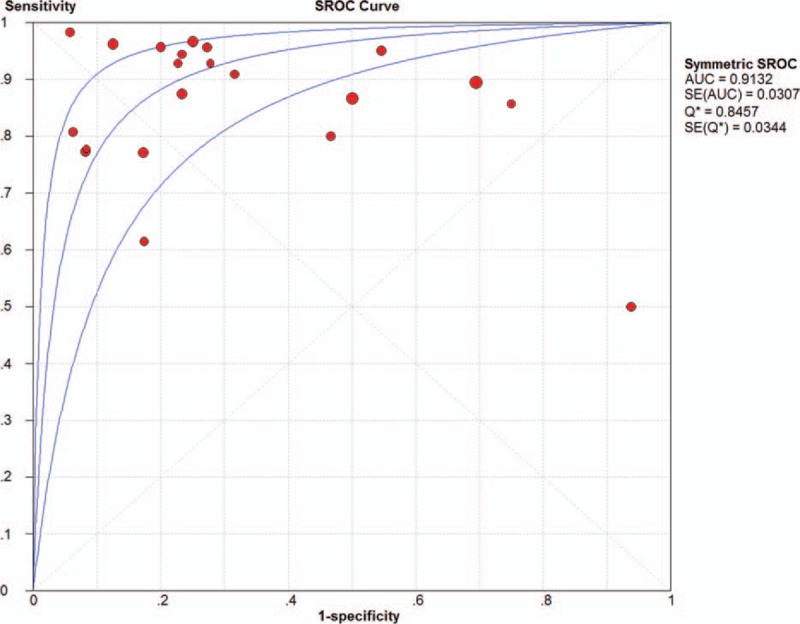
Results: A total of 20 publications reporting 21 studies were identified. Pooled results indicated that F-FDG-PET/CT showed a diagnostic sensitivity of 0.89 (95% confidence interval [CI], 0.87-0.91) and a specificity of 0.70 (95% CI, 0.66-0.73). The positive likelihood ratio was 3.33 (95% CI, 2.35-4.71) and the negative likelihood ratio was 0.18 (95% CI, 0.13-0.25). The diagnostic odds ratio was 22.43 (95% CI, 12.55-40.07).
Conclusions: F-FDG-PET/CT showed insufficient sensitivity and specificity for diagnosing malignant SPNs; it cannot replace the "gold standard" pathology by resection or percutaneous biopsy. Larger studies are required for further evaluation.
Conflict of interest statement
The authors have no conflicts of interest to disclose.
Figures
Similar articles
-
Is 18F-FDG PET/CT useful for the differential diagnosis of solitary pulmonary nodules in patients with idiopathic pulmonary fibrosis?Ann Nucl Med. 2018 Aug;32(7):492-498. doi: 10.1007/s12149-018-1273-9. Epub 2018 Jul 4. Ann Nucl Med. 2018. PMID: 29974372
-
The value of four imaging modalities to distinguish malignant from benign solitary pulmonary nodules: a study based on 73 cohorts incorporating 7956 individuals.Clin Transl Oncol. 2021 Feb;23(2):296-310. doi: 10.1007/s12094-020-02418-3. Epub 2020 Jun 16. Clin Transl Oncol. 2021. PMID: 32548796
-
Characterization of the solitary pulmonary nodule: 18F-FDG PET versus nodule-enhancement CT.AJR Am J Roentgenol. 2006 Nov;187(5):1361-7. doi: 10.2214/AJR.05.1166. AJR Am J Roentgenol. 2006. PMID: 17056930
-
The role of ¹⁸F-FDG PET or ¹⁸F-FDG-PET/CT in the evaluation of solitary pulmonary nodules.Eur J Radiol. 2015 Oct;84(10):2032-7. doi: 10.1016/j.ejrad.2015.06.008. Epub 2015 Jun 11. Eur J Radiol. 2015. PMID: 26094866 Review.
-
18F-FDG-PET/CT versus 99Tcm-MIBI-SPECT: which is better for detection of solitary pulmonary nodules ?J BUON. 2017 Sep-Oct;22(5):1246-1251. J BUON. 2017. PMID: 29135109
Cited by
-
EarlyCDT Lung blood test for risk classification of solid pulmonary nodules: systematic review and economic evaluation.Health Technol Assess. 2022 Dec;26(49):1-184. doi: 10.3310/IJFM4802. Health Technol Assess. 2022. PMID: 36534989 Free PMC article.
-
Differentiation Between Malignant and Benign Pulmonary Nodules by Using Automated Three-Dimensional High-Resolution Representation Learning With Fluorodeoxyglucose Positron Emission Tomography-Computed Tomography.Front Med (Lausanne). 2022 Mar 18;9:773041. doi: 10.3389/fmed.2022.773041. eCollection 2022. Front Med (Lausanne). 2022. PMID: 35372415 Free PMC article.
-
Prospective evaluation of the diagnostic accuracy of FDG-PET/CT for the detection of sternal wound infection post-sternotomy.EJNMMI Rep. 2025 Feb 8;9(1):6. doi: 10.1186/s41824-024-00237-1. EJNMMI Rep. 2025. PMID: 39920552 Free PMC article.
-
Role of 18F-FDG PET/CT Radiomics Features in the Differential Diagnosis of Solitary Pulmonary Nodules: Diagnostic Accuracy and Comparison between Two Different PET/CT Scanners.J Clin Med. 2021 Oct 29;10(21):5064. doi: 10.3390/jcm10215064. J Clin Med. 2021. PMID: 34768584 Free PMC article.
-
An 18F-FDG-PET/CT-based radiomics signature for estimating malignance probability of solitary pulmonary nodule.Clin Respir J. 2024 May;18(5):e13751. doi: 10.1111/crj.13751. Clin Respir J. 2024. PMID: 38725315 Free PMC article.
References
-
- Ost D, Fein AM, Feinsilver SH. Clinical practice. The solitary pulmonary nodule. N Eng J Med 2003;348:2535–42. - PubMed
-
- Winer-Muram HT. The solitary pulmonary nodule. Radiology 2006;239:34–49. - PubMed
-
- Leef JL, 3rd, Klein JS. The solitary pulmonary nodule. Radiol Clin North Am 2002;40:123–43. ix. - PubMed
-
- Dabrowska M, Kolasa A, Zukowska M, et al. [Analysis of solitary pulmonary nodules found in chest radiograms]. Pneumonol Alergol Pol 2009;77:37–42. - PubMed
Publication types
MeSH terms
Substances
LinkOut - more resources
Full Text Sources
Other Literature Sources
