

Which aortic clamp strategy is better to reduce postoperative stroke and death: Single center report and a meta-analysis
- PMID: 29561451
- PMCID: PMC5895326
- DOI: 10.1097/MD.0000000000010221
Which aortic clamp strategy is better to reduce postoperative stroke and death: Single center report and a meta-analysis
Abstract
Background: Stroke is severe complication of coronary artery bypass grafting (CABG) which may be associated with clamp strategy, there are 2 strategies to clamp aorta including single aortic clamp (SAC) and partial aortic clamp (PAC). It is controversial that which clamping strategy is better to reduce the postoperative stroke and death, so this study aims to investigate which is better for reducing postoperative stroke and death within 30 days.
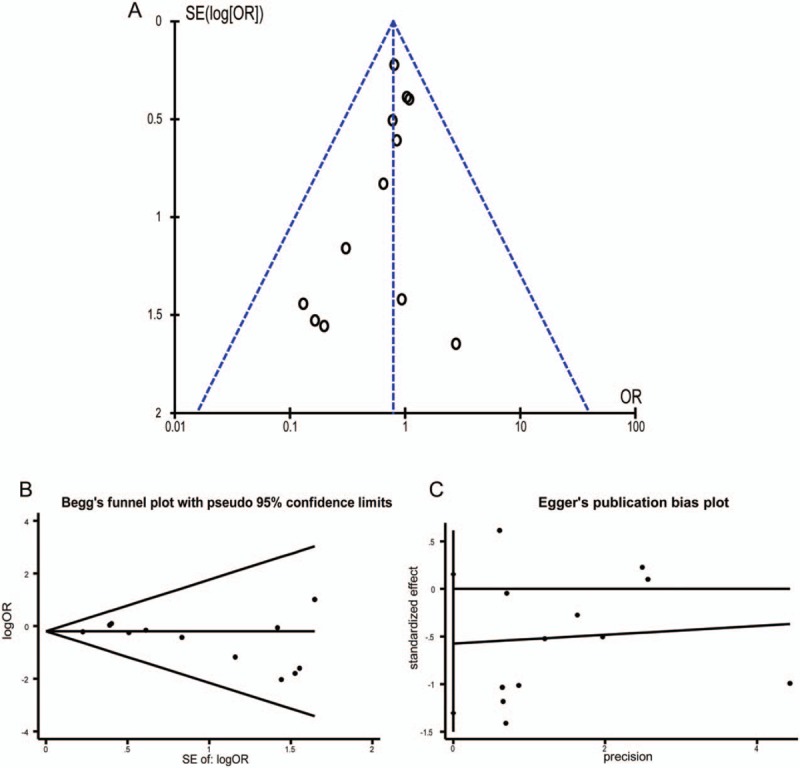
Methods: We collected 469 patients who had on-pump CABG in Fuwai Hospital during January 2014 to July 2015. The SAC group consisted of 265 patients while the PAC group included 204 patients. We compared the 2 group patient difference. At the same time, 12 studies were identified by systematic search. The odds ratio (OR) was used as effect index to compare SAC and PAC strategy by fix-effect modeling. We also tested heterogeneity and publication bias. The primary end point of study was occurrence of postoperative stroke within 30 days of operation, the second end point of study was the incidence of 30-day mortality.
Results: The single center retrospective study showed that the patients in the SAC group were older than those in the PAC group (62.5 ± 8.1 vs 60.3 ± 8.0 years, P = .01). The proportions of peripheral vascular disease and hypertension of SAC were higher than PAC (71 (26.8%) versus 36 (17.6%), P = .02; 183 (69.1%) versus 115 (56.4%), P = .01, respectively). Besides, the number of vascular anastomosis was more in the SAC group (3.29 ± 0.74 versus 2.97 ± 0.974, P < .001). The linear-regression analysis suggested that the time of cardiopulmonary bypass of SAC was shorter than the PAC group (93.2 ± 22.4 vs.103.4 ± 26.8 minutes, P-regression < .001) and postoperative death within 30-days was similar (1 (0.4%) vs. 2 (1.0%), P-regression = .47). There was no stroke occurring in both the groups. And the meta-analysis suggested the postoperative stroke and death within 30-days were similar between SAC group and PAC group (OR: 0.78, 95% CI: 0.58-1.06; OR: 0.82, 95% CI: 0.61-1.10; respectively). Moreover, subgroup meta-analysis also had the same results.
Conclusion: There was no significant difference between SAC and PAC clamping strategy on postoperative stroke and death within 30-days; however, SAC can reduce the usage time of cardiopulmonary bypass.
Conflict of interest statement
The authors have no conflicts of interest to disclose.
Figures


Similar articles
-
Effect of Aortic Clamping Strategy on Postoperative Stroke in Coronary Artery Bypass Grafting Operations.JAMA Surg. 2016 Jan;151(1):59-62. doi: 10.1001/jamasurg.2015.3097. JAMA Surg. 2016. PMID: 26398924
-
Avoiding aortic clamping during coronary artery bypass grafting reduces postoperative stroke.J Thorac Cardiovasc Surg. 2015 Jan;149(1):175-80. doi: 10.1016/j.jtcvs.2014.09.011. Epub 2014 Sep 16. J Thorac Cardiovasc Surg. 2015. PMID: 25293356 Free PMC article.
-
Effects of single aortic clamping versus partial aortic clamping techniques on post-operative stroke during coronary artery bypass surgery.Cardiovasc J Afr. 2013 Jul;24(6):213-7. doi: 10.5830/CVJA-2013-038. Cardiovasc J Afr. 2013. PMID: 24217261 Free PMC article.
-
Off-pump coronary artery bypass grafting improves short-term outcomes in high-risk patients compared with on-pump coronary artery bypass grafting: Meta-analysis.J Thorac Cardiovasc Surg. 2016 Jan;151(1):60-77.e1-58. doi: 10.1016/j.jtcvs.2015.08.042. Epub 2015 Aug 15. J Thorac Cardiovasc Surg. 2016. PMID: 26433633 Review.
-
Off-pump vs. on-pump coronary artery bypass surgery: an updated meta-analysis and meta-regression of randomized trials.Eur Heart J. 2012 May;33(10):1257-67. doi: 10.1093/eurheartj/ehr307. Epub 2011 Oct 10. Eur Heart J. 2012. PMID: 21987177 Review.
References
-
- Hansson GK. Inflammation, atherosclerosis, and coronary artery disease. N Engl J Med 2005;352:1685–95. - PubMed
-
- Boudoulas KD, Triposciadis F, Geleris P, et al. Coronary atherosclerosis: pathophysiologic basis for diagnosis and management. Prog Cardiovasc Dis 2016;58:676–92. - PubMed
-
- Serruys PW, Morice MC, Kappetein AP, et al. Percutaneous coronary intervention versus coronary-artery bypass grafting for severe coronary artery disease. N Engl J Med 2009;360:961–72. - PubMed
-
- Kim JB, Yun SC, Lim JW, et al. Long-term survival following coronary artery bypass grafting: off-pump versus on-pump strategies. J Am Coll Cardiol 2014;63:2280–8. - PubMed
Publication types
MeSH terms
LinkOut - more resources
Full Text Sources
Other Literature Sources
Medical
