Comparative Study
. 2018 Apr;95(4):277-291.
doi: 10.1097/OPX.0000000000001197.

Polarization Variability in Age-related Macular Degeneration

Affiliations
Comparative Study

Polarization Variability in Age-related Macular Degeneration

Dean A VanNasdale et al. Optom Vis Sci. 2018 Apr.

Abstract

Significance: Age-related macular degeneration (AMD) is a leading cause of irreversible vision loss. Complementary imaging techniques can be used to better characterize and quantify pathological changes associated with AMD. By assessing specific light-tissue interactions, polarization-sensitive imaging can be used to detect tissue disruption early in the disease process.

Purpose: The aim of this study was to compare variability in central macular polarization properties in patients with nonexudative AMD and age-matched control subjects.

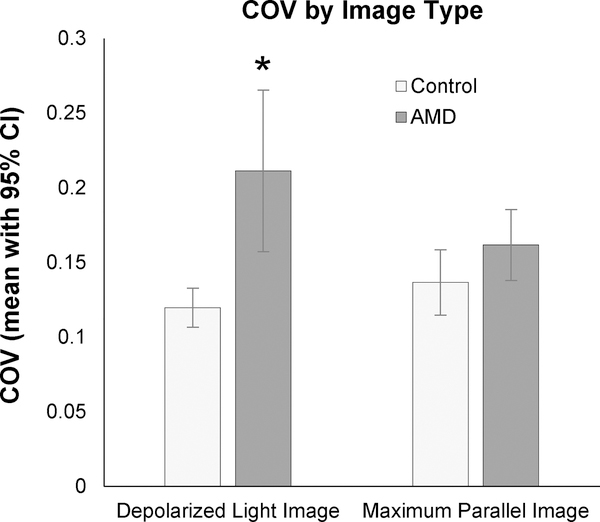
Methods: A scanning laser polarimeter (GDx, LDT/CZM) was used to acquire 15 × 15-degree macular images in 10 subjects diagnosed with nonexudative AMD and 10 age-matched control subjects. The coefficient of variation (COV, SD/mean) was used to quantify variability in pixel intensity in the central 3.3° of the macula for custom images emphasizing multiply scattered light (the depolarized light image) and polarization-retaining light (the maximum of the parallel detector image). The intensity COV was compared across subject categories using paired t tests for each image type.

Results: The COV in the central macula was significantly higher in the AMD subject group (average, 0.221; 95% confidence interval [CI], 0.157 to 0.265) when compared with matched control subjects (average 0.120; 95% CI, 0.107 to 0.133) in the depolarized light image (P = .01). The COV in the maximum of the parallel detector image was not statistically different between the two subject groups (AMD average, 0.162 [95% CI, 0.138 to 0.185]; control average, 0.137 [95% CI, 0.115 to 0.158]; P = .21).

Conclusions: Variability in multiply scattered light is higher than that of light that is more polarization preserving in patients with nonexudative AMD. Multiple scattering may act as an early indicator representing disruption to the macula in early AMD.


Figures

Figure 1.
Figure 1.
Scanning laser polarimetry images from a subject with non-exudative age-related macular degeneration. (A) The Maximum Phase of the Crossed Detector Image demonstrates a relatively intact macular cross pattern used to localize the central fovea in other images derived from the same raw dataset. From the parallel detector, the maximum intensity over the entire image series at each pixel is used to create the Maximum of the Parallel Detector Image (B). This image emphasizes features that are primarily singly scattering or specularly reflecting, which are often the more superficial retinal features. From the crossed detector, the minimum in the modulation over the entire image series at each pixel is used to create the Depolarized Light Image (C). This image emphasizes features that multiply scatter, which includes the retinal pigment epithelium and pathological features commonly found in the deeper retina.
Figure 2.
Figure 2.
(A) The Depolarized Light Image and (B) the Maximum of the Parallel Detector Image in a 71 year old control subject. (C) The Depolarized Light Image and (D) the Maximum of the Parallel Detector Image in a 71 year old subject with non-exudative age-related macular degeneration.
Figure 3.
Figure 3.
The average coefficient of variation in image intensity over the central macula in each of the three image types used for analysis with 95% confidence intervals. The Depolarized Light Image showed a higher coefficient of variation in the age-related macular degeneration subjects than in the controls (p=0.01, marked with an asterisk). The Maximum of the Parallel detector image did not show differences in coefficient of variation between the two subject groups (p=0.231).
Figure 4.
Figure 4.
(A) Fundus photograph demonstrating multiple small areas of early retinal pigment epithelium disruption localized in spectral domain optical coherence tomography, indicated by the numbered arrows. Because of the low contrast and lack of depth information, these changes are difficult to differentiate from other pathological features associated with age-related macular degeneration. (B) A scanning laser ophthalmoscope image from the Heidelberg Spectralis registered and cropped to match the orientation and dimensions of the scanning laser polarimetry-derived images. The green line in the scanning laser ophthalmoscope image indicates the scan location for the middle of 3 consecutive spectral domain optical coherence tomography b-scan images acquired at 60 μm intervals (C). The scanning laser polarimetry derived Depolarized Light Image (D) and Maximum of the Parallel Detector Image (E). The numbered arrows correspond to the same location in each image type and localize areas of early retinal pigment epithelium disruption.
Figure 5.
Figure 5.
(A) Fundus photograph of multiple areas of drusen localized in spectral domain optical coherence tomography, indicated by the numbered arrows. (B) A scanning laser ophthalmoscope with green lines indicating the scan location for spectral domain optical coherence tomography b-scan images (C). Spectral domain optical coherence tomography b-scans delineate drusen boundaries and can be used to differentiate drusen based on morphological characteristics. The spectral domain optical coherence tomography b-scans show elevations in the deep retinal structure, including the retinal pigment epithelium and photoreceptor inner segment/outer segment junction. Small focal drusen with low internal reflectivity appear as localized areas with high intensity borders that surround a lower intensity central core in the Depolarized Light Image (D). The drusen borders in the Depolarized Light Image closely match the boundary of deep retinal elevations in spectral domain optical coherence tomography. In the Maximum of the Parallel Detector Image (E), these drusen appear as highly reflective in locations 2 and 3, but are difficult to differentiate due to low contrast in location 1. Similarly, drusen in location 1 are difficult to localize in the fundus photograph.
Figure 6.
Figure 6.
A scanning laser ophthalmoscope image from the Heidelberg Spectralis (A), with a spectral domain optical coherence tomography b-scan (B). Spectral domain optical coherence tomography b-scans delineate the boundary of the druse and can be used to differentiate it based on morphological characteristics. The spectral domain optical coherence tomography b-scan show elevations in the deep retinal structure, including the retinal pigment epithelium and photoreceptor inner segment/outer segment junction. This large druse appears as a localized area with a high intensity border surrounding a lower intensity central core in the Depolarized Light Image (C). The border in the Depolarized Light Image is much narrower than that in the Maximum of the Parallel Detector Image (D).
Figure 7.
Figure 7.
A scanning laser ophthalmoscope image from the Heidelberg Spectralis (A), and corresponding spectral domain optical coherence tomography b-scan (B). Spectral domain optical coherence tomography b-scans delineate the boundary of the hyper-reflective foci and several drusen along the scan line. The location of the large druse with overlying hyper-reflective foci in spectral domain optical coherence tomography b-scans also shows disruption to the retinal pigment epithelium and photoreceptor inner segment/outer segment junction. The large druse and overlying hyper-reflective foci are seen with high contrast as high intensity features in the Depolarized Light Image (C), while other drusen along the scan line demonstrate high intensity borders surrounding a lower intensity central core. The borders of pathological features in the Depolarized Light Image match the boundaries of deep retinal elevations and hyper-reflective foci in spectral domain optical coherence tomography. In the Maximum of the Parallel Detector Image (D), the hyper-reflective foci in the spectral domain optical coherence tomography image is seen as highly reflective. Drusen in the Maximum of the Parallel Detector Image are variable and appear with lower contrast, with some drusen appearing as highly reflective, consistent with high reflectivity changes in the inner segment/outer segment junction overlying some drusen.
Figure 8.
Figure 8.
A scanning laser ophthalmoscope image from the Heidelberg Spectralis (A), with a spectral domain optical coherence tomography b-scan (B). Spectral domain optical coherence tomography b-scans delineate the boundary of the subretinal deposits, accumulating between the retinal pigment epithelium and overlying photoreceptors. Subretinal deposits are seen as high intensity features with a lower intensity border that is irregular in the Depolarized Light Image (C). The border in the Depolarized Light Image closely match the boundaries of deep retinal elevations and debris accumulation seen in the spectral domain optical coherence tomography b-scan. In the Maximum of the Parallel Detector Image (D), the subretinal deposits appeared as more uniform in intensity with low contrast.
Figure 9.
Figure 9.
(A) Fundus photograph of focal drusen (arrow 1), pigment clumping (arrow 2), and early retinal pigment epithelium disruption (arrow 3). The color information from the fundus photograph indicates an area of pigment clumping. A scanning laser ophthalmoscope image from the Heidelberg Spectralis (B), the scan location for spectral domain optical coherence tomography b-scan (C). The spectral domain optical coherence tomography b-scans (C) show disruptions to the deep retinal structure, corresponding to each of the 3 types of changes, which are also seen in the fundus photograph and scanning laser polarimetry-derived images (D and E).

Similar articles

Cited by

References

    1. Age-related Eye Disease Study Research Group. The Age-related Eye Disease Study (Age-Related Eye Disease Study) System for Classifying Cataracts from Photographs: Age-Related Eye Disease Study report no. 4. Am J Ophthalmol 2001;131:167–75. - PMC - PubMed
    1. Freeman SR, Kozak I, Cheng L, et al. Optical Coherence Tomography-Raster Scanning and Manual Segmentation in Determining Drusen Volume in Age-related Macular Degeneration. Retina 2010;30:431–5. - PubMed
    1. Zweifel SA, Imamura Y, Spaide TC, et al. Prevalence and Significance of Subretinal Drusenoid Deposits (Reticular Pseudodrusen) in Age-related Macular Degeneration. Ophthalmology 2010;117:1775–81. - PubMed
    1. Sarks SH. Ageing and Degeneration in the Macular Region: a Clinico-pathological study. Br J Ophthalmol 1976;60:324–41. - PMC - PubMed
    1. Anderson DH, Mullins RF, Hageman GS, Johnson LV. A Role for Local Inflammation in the Formation of Drusen in the Aging Eye. Am J Ophthalmol 2002;134:411–31. - PubMed

Publication types