. 2018 Apr 19;10(15):6900-6910.
doi: 10.1039/C7NR08614H.

Two mechanisms of nanoparticle generation in picosecond laser ablation in liquids: the origin of the bimodal size distribution

Affiliations

Two mechanisms of nanoparticle generation in picosecond laser ablation in liquids: the origin of the bimodal size distribution

Cheng-Yu Shih et al. Nanoscale. .

Abstract

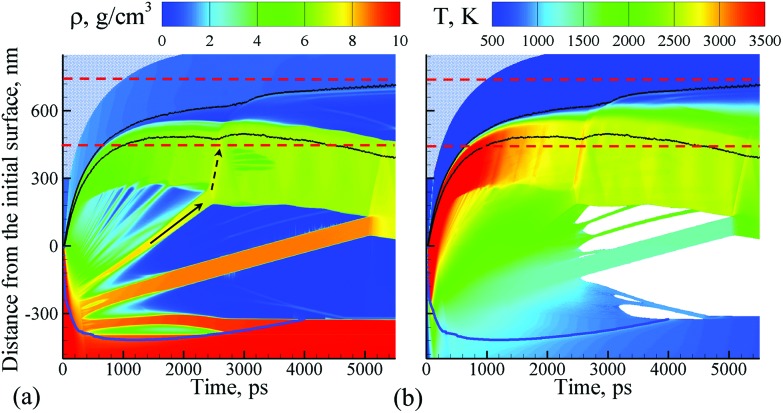
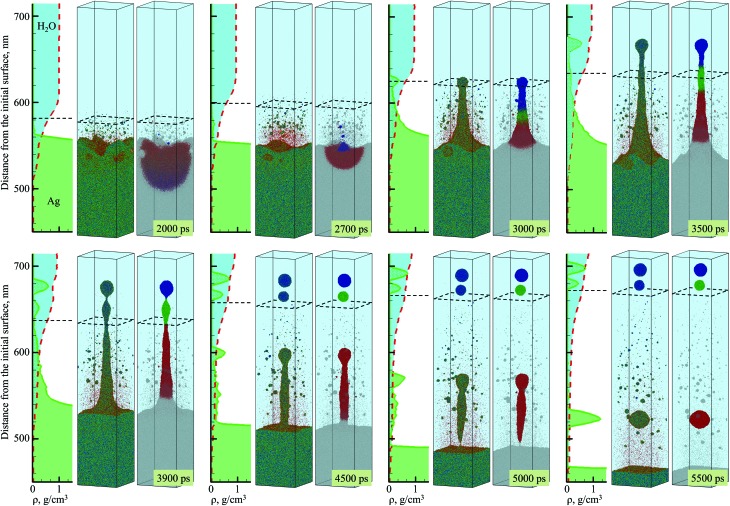
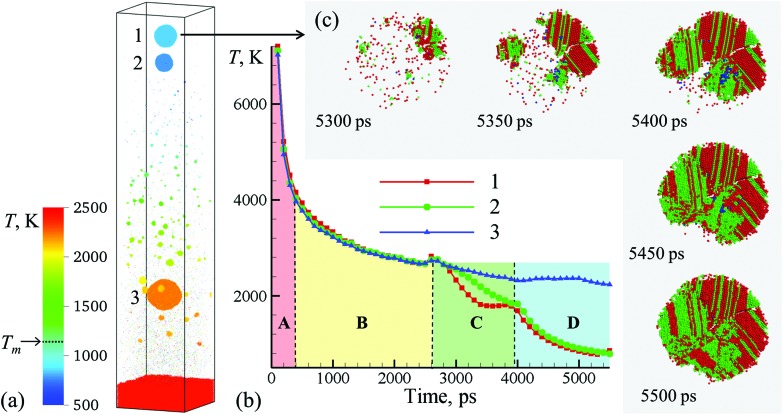
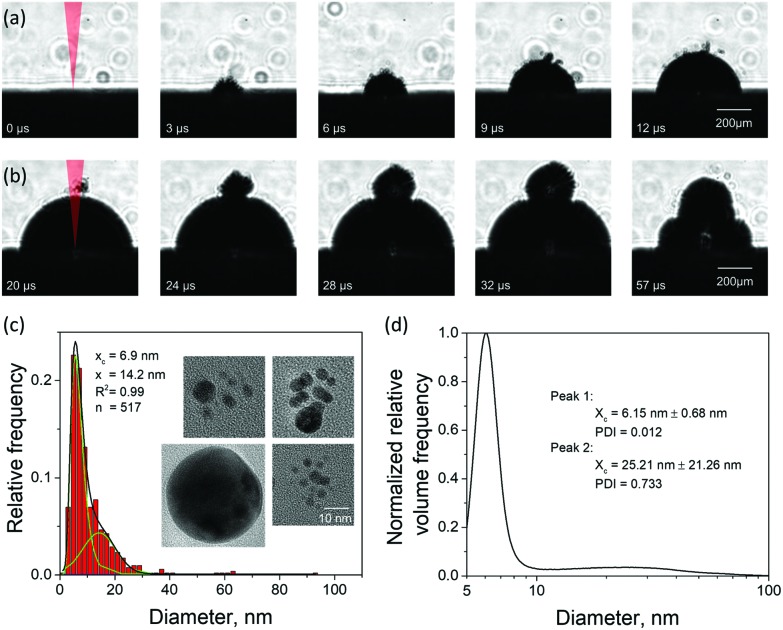
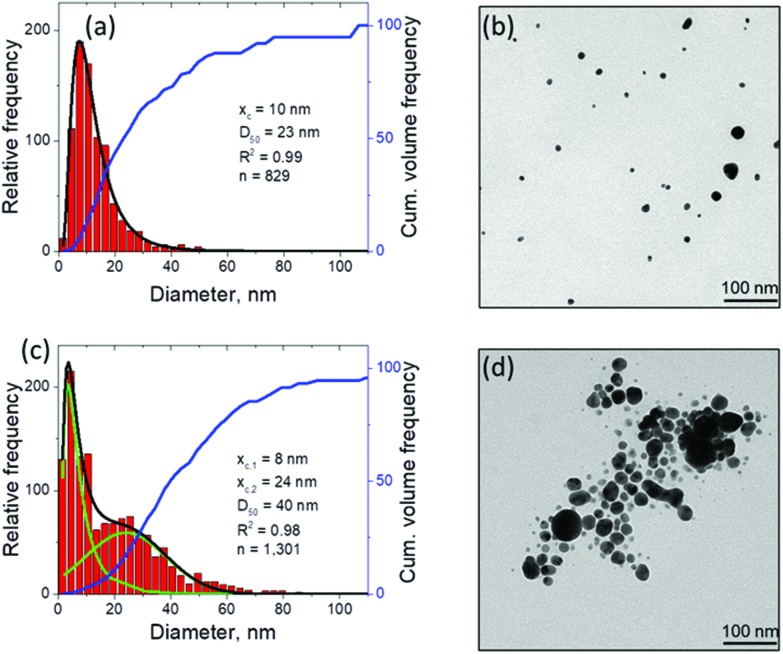
The synthesis of chemically clean and environmentally friendly nanoparticles through pulsed laser ablation in liquids has shown a number of advantages over conventional chemical synthesis methods and has evolved into a thriving research field attracting laboratory and industrial applications. The fundamental understanding of processes leading to the nanoparticle generation, however, still remains elusive. In particular, the origin of bimodal nanoparticle size distributions in femto- and picosecond laser ablation in liquids, where small nanoparticles (several nanometers) with narrow size distribution are commonly observed to coexist with larger (tens to hundreds of nanometers) ones, has not been explained so far. In this paper, joint computational and experimental efforts are applied to understand the mechanisms of nanoparticle formation in picosecond laser ablation in liquids and to explain the bimodal nanoparticle size distributions. The results of a large-scale atomistic simulation reveal the critical role of the dynamic interaction between the ablation plume and the liquid environment, leading to the generation of large nanoparticles through a sequence of hydrodynamic instabilities at the plume-liquid interface and a concurrent nucleation and growth of small nanoparticles in an expanding metal-liquid mixing region. The computational predictions are supported by a series of stroboscopic videography experiments showing the emergence of small satellite bubbles surrounding the main cavitation bubble generated in single pulse experiments. Carefully timed double pulse irradiation triggers expansion of secondary cavitation bubbles indicating, in accord with the simulation results, the presence of localized sites of laser energy deposition (possibly large nanoparticles) injected into the liquid at the early stage of the bubble formation.


Figures

Fig. 1
Fig. 1. Density (a) and temperature (b) contour plots predicted in atomistic simulation of laser ablation of a bulk silver target irradiated in water by a 10 ps laser pulse at an absorbed fluence of 600 mJ cm–2. The blue line shows the location of the melting and solidification fronts. The two black lines outline the water-Ag mixing region defined as a region where both water molecules and Ag atoms are present. The blue dot background represents the presence of water beyond the pressure-transmitting boundary applied at the top of the water layer that is explicitly simulated with coarse-grained MD. The two dashed red lines outline the region for which snapshots of atomic configurations are shown in Fig. 2. The solid and dashed arrows show the trajectory of a spalled layer and a pressure pulse generated by collision of this layer with the molten metal layer accumulated at the interface with water environment, respectively.
Fig. 2
Fig. 2. Snapshots of atomic configurations and density distribution predicted in atomistic simulation of laser ablation of a bulk silver target irradiated in water by a 10 ps laser pulse at an absorbed fluence of 600 mJ cm–2. Only a part of the computational system from 450 to 715 nm with respect to the initial surface of the silver target is shown in the figure. Two representations of atomic configurations are provided for each moment of time. On the left side of the paired snapshots, the atoms are colored according to their potential energies, from blue for the crystalline nanoparticles, to green for molten Ag, and to red for individual Ag atoms. On the right side of the paired snapshots, the atoms are colored based on IDs of three nanoparticles generated through the rupture of the liquid nanojet (each color except grey corresponds to atoms that end up in one of the three nanoparticles). The molecules representing water environment are blanked and the presence of water is illustrated schematically as a bright blue region above the Ag target. The degree of water-silver mixing is illustrated by density plots shown as functions of distance from the substrate for both water and silver to the left from the corresponding snapshots; the red dashed line and light blue fill color represent water density distribution, the green solid line and light green fill color represent Ag density distribution. The black dashed squares in the atomistic snapshots and the horizontal dashed lines in the density plots show approximate positions of the diffuse “boundary” between the dense water and low-density mixing region defined here as the position where the water density is 0.6 g cm–3.
Fig. 3
Fig. 3. (a) Snapshot of the final configurations obtained for 5.5 ns after the laser pulse in a simulation of a bulk Ag target irradiated in water by a 10 ps laser pulse at an absorbed fluence of 600 mJ cm–2. Only a part of the computational system from 450 to 715 nm with respect to the initial surface of the Ag target is shown in the snapshot. The atoms in the snapshot are colored by local temperature. (b) The time dependence of the average temperature of atoms that belong to the one of the three nanoparticles generated through the rupture of the liquid nanojet shown in Fig. 2. (c) The process of crystallization in the topmost nanoparticle (15 nm in diameter) ejected from the liquid nanojet. The atoms are colored according to their local structural environment, so that the fcc, hcp, and bcc atoms are colored green, red, and blue, respectively, while the atoms that belong to the melted parts of the nanoparticles, crystal defects, and free surfaces are blanked.
Fig. 4
Fig. 4. Experimental results on the cavitation bubble dynamics and generation of nanoparticles in LAL of Au targets irradiated by 10 ps laser pulses in water at an incident fluence of 3.4 J cm–2 ± 0.51 J cm–2 and laser wavelength of 1064 nm. (a) Images of a cavitation bubble with rough boundary (satellite microbubbles) generated by a single laser pulse irradiation taken at regular intervals during the first 12 μs after the laser pulse. (b) Images of the cavitation bubble dynamics modified by a second pulse applied at 20 μs after the first one, i.e., during expansion of the first cavitation bubble. The first four images are separated from each other by 4 μs, and the fifth image is taken 25 μs after the fourth image, i.e., during the shrinking phase. (c) Size distribution of Au nanoparticles generated by single pulse LAL and obtained from analysis of TEM images, with several representative images shown as insets. The scale bar is common for all insets and corresponds to 10 nm. (d) Nanoparticle size distribution obtained through analytical disc centrifugation measurement for nanoparticle solution produced under the same experimental conditions as in (c) but for a continuous ablation with a repetition rate of 200 kHz. Volume frequency is shown to increase the visibility of the second mode.
Fig. 5
Fig. 5. Nanoparticle characterization by means of TEM with image analysis after continuous picosecond LAL synthesis from flat gold (a, b) and silver (c, d) targets in a flow chamber. The laser differs from that used in Fig. 4, for details see Methods section. The black curve in (a) shows the lognormal envelope of the histogram. In (c), the black curve shows the sum of the two underlying fits, a lognormal (xc,1) and a Gaussian (xc,2) one, shown in green. Obviously, the predicted bimodality from the computational model is experimentally better reproduced by the ablation of silver compared to the ablation of gold.

References

    1. Barcikowski S., Devesa F., Moldenhauer K. J. Nanopart. Res. 2009;11:1883–1893.
    1. Amendola V., Meneghetti M. Phys. Chem. Chem. Phys. 2009;11:3805–3821. - PubMed
    1. Zhang D., Gökce B., Barcikowski S. Chem. Rev. 2017;117:3990–4103. - PubMed
    1. Rehbock C., Jakobi J., Gamrad L., van der Meer S., Tiedemann D., Taylor U., Kues W., Rath D., Barcikowski S. Beilstein J. Nanotechnol. 2014;5:1523–1541. - PMC - PubMed
    1. Streubel R., Barcikowski S., Gökce B. Opt. Lett. 2016;41:1486–1489. - PubMed

LinkOut - more resources