. 2018 Aug 1;315(2):R241-R255.
doi: 10.1152/ajpregu.00402.2017. Epub 2018 Mar 21.

Social status affects lipid metabolism in rainbow trout, Oncorhynchus mykiss

Affiliations

Social status affects lipid metabolism in rainbow trout, Oncorhynchus mykiss

Daniel J Kostyniuk et al. Am J Physiol Regul Integr Comp Physiol. .

Abstract

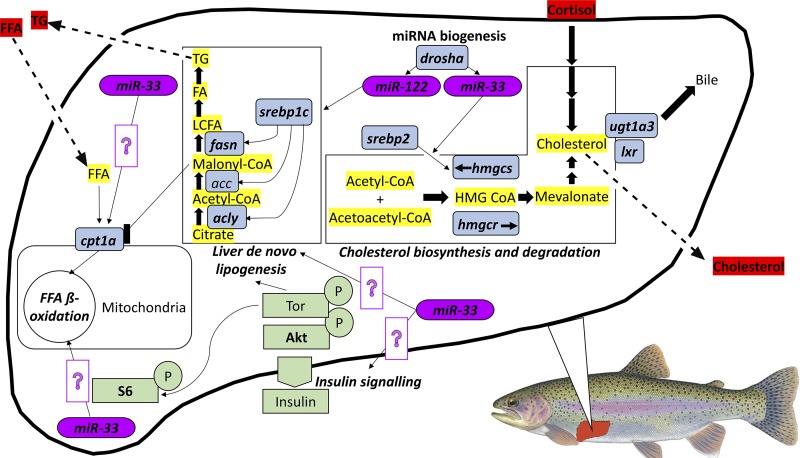
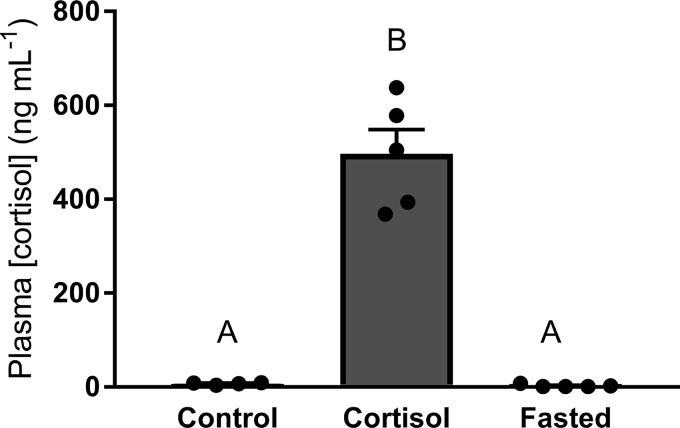
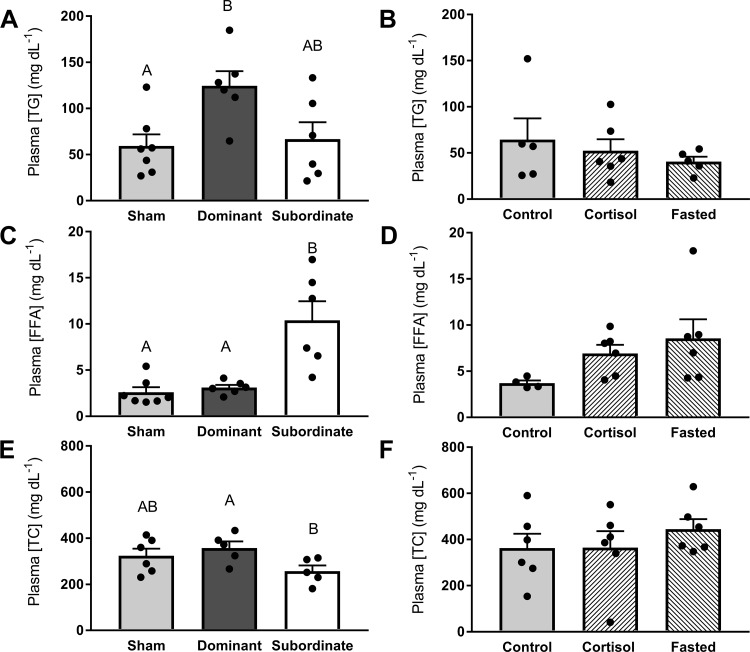
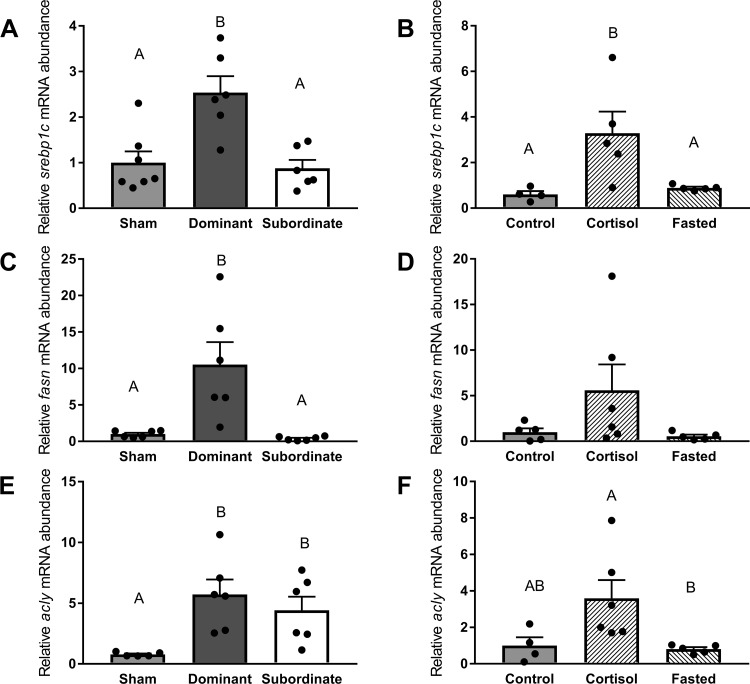
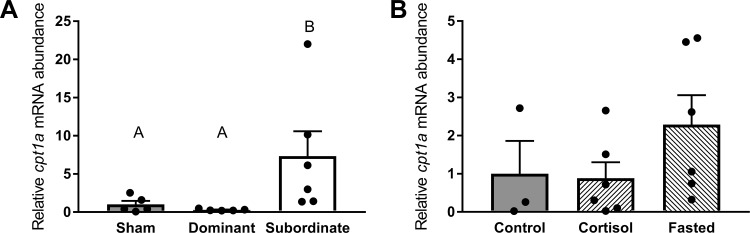
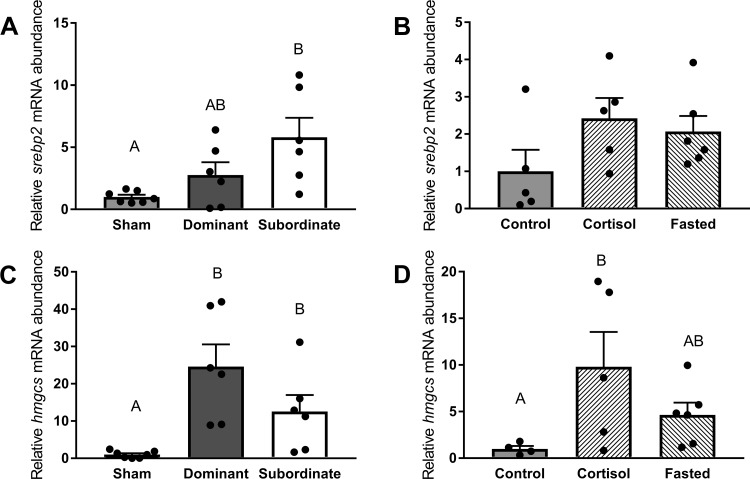
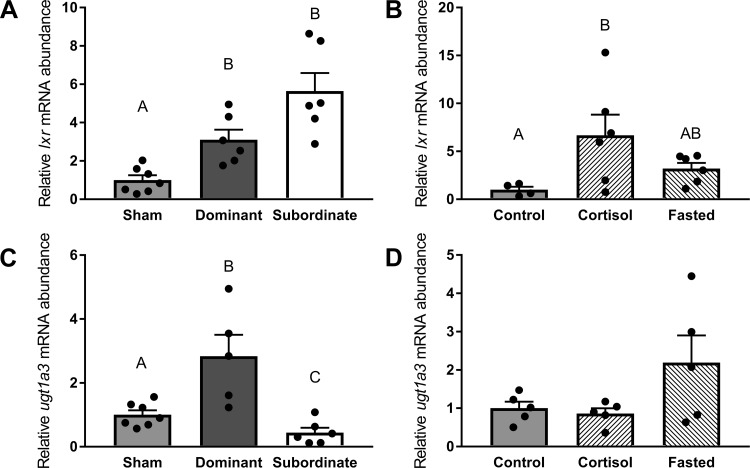
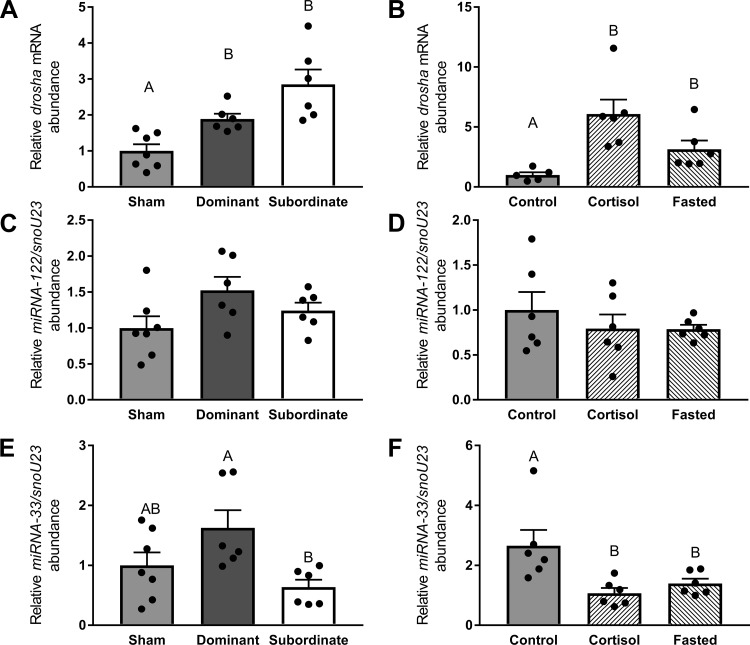
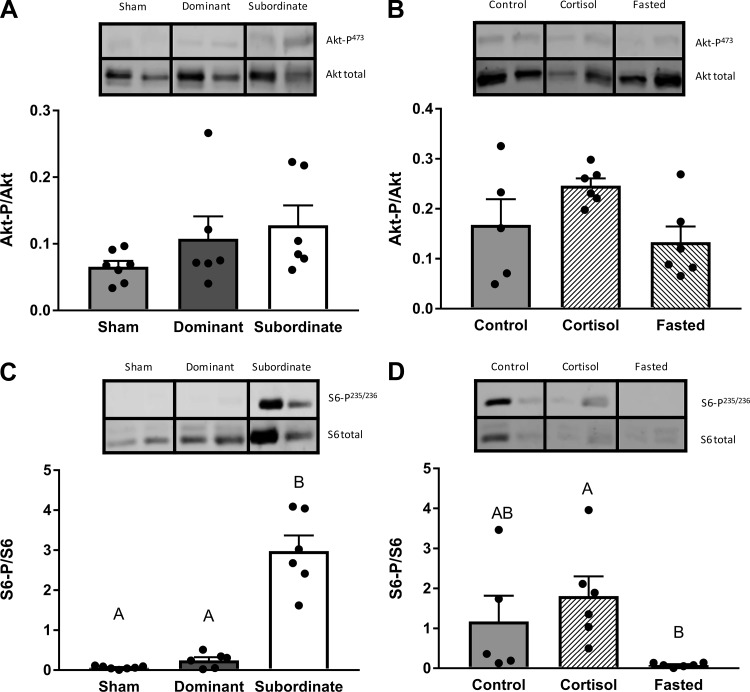
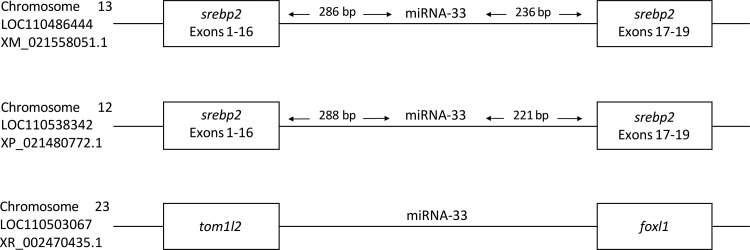
Juvenile rainbow trout ( Oncorhynchus mykiss) confined in pairs form social hierarchies in which socially subordinate fish display characteristic traits, including reduced growth rates and altered glucose metabolism. These effects are, in part, mediated by chronically elevated cortisol levels and/or reduced feeding. To determine the effects of social status on lipid metabolism, trout were held in pairs for 4 days, following which organismal and liver-specific indexes of lipid metabolism were measured. At the organismal level, circulating triglycerides were elevated in dominant trout, whereas subordinate trout exhibited elevated concentrations of circulating free fatty acids (FFAs) and lowered plasma total cholesterol levels. At the molecular level, increased expression of lipogenic genes in dominant trout and cpt1a in subordinate trout was identified, suggesting a contribution of increased de novo lipogenesis to circulating triglycerides in dominant trout and reliance on circulating FFAs for β-oxidation in the liver of subordinates. Given the emerging importance of microRNAs (miRNA) in the regulation of hepatic lipid metabolism, candidate miRNAs were profiled, revealing increased expression of the lipogenic miRNA-33 in dominant fish. Because the Akt-TOR-S6-signaling pathway is an important upstream regulator of hepatic lipid metabolism, its signaling activity was quantified. However, the only difference detected among groups was a strong increase in S6 phosphorylation in subordinate trout. In general, the changes observed in lipid metabolism of subordinates were not mimicked by either cortisol treatment or fasting alone, indicating the existence of specific, emergent effects of subordinate social status itself on this fuel.

Keywords: behavior; cell signaling; energy metabolism; gene expression; hierarchy; liver, microRNA; salmonid.


Figures

Fig. 1.
Fig. 1.
Schematic of hepatic lipid metabolic pathways investigated in this study. Protein kinase B/target of rapamycin/ribsosomal protein S6 (Akt/Tor/S6) pathway components are highlighted in green, key metabolic enzymes in blue and microRNAs are in purple. Circulating metabolites are highlighted in red, while metabolites present within the liver are highlighted in yellow. In all cases, bold letters indicate variables measured in this study. Established functional relationships between measured parameters are based on previous literature (15, 17, 57), and question mark symbols indicate predicted interactions. FFA, free fatty acid; srebp1c, sterol regulatory element-binding protein 1c; fasn, fatty acid synthase; acly, ATP citrate lyase; cpt1a, carnitine palmitoyltransferase 1A; hmgcs, hydroxymethylglutaryl-CoA synthase; lxr, liver X receptor; ugt1a3, UDP glucuronosyltransferase family 1 member A3; srebp2, sterol regulatory element-binding protein 2.
Fig. 2.
Fig. 2.
Plasma cortisol concentrations of control, cortisol-treated, and fasted rainbow trout (Oncorhynchus mykiss). Values are presented as means ± SE with n = 5–7 for all groups; values for individuals included in the means are indicated by the symbols. Bars that share a letter are not significantly different from one another (see text for details).
Fig. 3.
Fig. 3.
Plasma concentrations of triglycerides (TG; A and B), free fatty acids (FFAs; C and D), and total cholesterol (TC; E and F) in sham, dominant, and subordinate (A, C, and E), and control, cortisol-treated, and fasted (B, D, and F) rainbow trout (Oncorhynchus mykiss). Values are presented as means ± SE with n = 5–7 for all groups; values for individuals included in the means are indicated by the symbols. Bars that share a letter are not significantly different from one another (see text for details).
Fig. 4.
Fig. 4.
Abundance of mRNA markers of hepatic lipogenesis pathways. Transcript levels of sterol regulatory element-binding protein 2 (srebp1c; A and B), fatty acid synthase (fasn; C and D), and ATP citrate lyase (acly; E and F) in sham, dominant, and subordinate (A, C, and E) and control, cortisol-treated, and fasted (B, D, and F) rainbow trout (Oncorhynchus mykiss). Values are presented as means ± SE with n = 4–7 for all groups; values for individuals included in the means are indicated by the symbols. Bars that share a letter are not significantly different from one another (see text for details).
Fig. 5.
Fig. 5.
mRNA abundance of the β-oxidation marker carnitine palmitoyltransferase 1A (cpt1a) in sham, dominant, and subordinate (A) and control, cortisol-treated, and fasted (B) rainbow trout (Oncorhynchus mykiss). Values are presented as means ± SE with n = 3–7 for all groups; values for individuals included in the means are indicated by the symbols. Bars that share a letter are not significantly different from one another (see text for details).
Fig. 6.
Fig. 6.
Abundance of mRNA markers of total cholesterol (TC) biosynthesis pathways. Transcript levels of sterol regulatory element-binding protein 2 (srebp2; A and B) and hydroxymethylglutaryl-CoA synthase (hmgcs; C and D) in sham, dominant, and subordinate (A and C) and control, cortisol-treated, and fasted (B and D) rainbow trout (Oncorhynchus mykiss). Values are presented as means ± SE with n = 4–7 for all groups; values for individuals included in the means are indicated by the symbols. Bars that share a letter are not significantly different from one another (see text for details).
Fig. 7.
Fig. 7.
Abundance of mRNA markers of total cholesterol (TC) degradation pathways. Transcript levels of liver X receptor (lxr; A and B) and UDP glucuronosyltransferase family 1 member A3 (ugt1a3; C and D) in sham, dominant, and subordinate (A and C) and control, cortisol-treated, and fasted (B and D) rainbow trout (Oncorhynchus mykiss). Values are presented as means ± SE with n = 4–7 for all groups; values for individuals included in the means are indicated by the symbols. Bars that share a letter are not significantly different from one another (see text for details).
Fig. 8.
Fig. 8.
Abundance of mRNA of the rate-limiting enzyme in miRNA biogenesis drosha (A and B) and lipid metabolism-related miRNA-122 (C and D) and miRNA-33 (E and F) in sham, dominant, and subordinate (A, C, and E) and control, cortisol-treated, and fasted (B, D, and F) rainbow trout (Oncorhynchus mykiss). Values are presented as means ± SE with n = 5–7 for all groups; values for individuals included in the means are indicated by the symbols. Bars that share a letter are not significantly different from one another (see text for details).
Fig. 9.
Fig. 9.
Ratio of phosphorylated protein to total protein for Akt (A and B) and S6 (C and D) pathways in sham, dominant, and subordinate (A and C) and control, cortisol-treated, and fasted (B and D) rainbow trout (Oncorhynchus mykiss). Values are presented as means ± SE with n = 5–7 for all groups; values for individuals included in the means are indicated by the symbols. Bars that share a letter are not significantly different from one another (see text for details). Representative images of Western blots are included.
Fig. 10.
Fig. 10.
Schematic illustrating the genomic loci of miRNA-33 in rainbow trout (Oncorhynchus mykiss) derived from Salmobase (75).

Similar articles

Cited by

References

    1. Abbott JC, Dill LM. Patterns of aggressive attack in juvenile steelhead trout (Salmo gairdneri). Can J Fish Aquat Sci 42: 1702–1706, 1985. doi:10.1139/f85-213. - DOI
    1. Aluru N, Leatherland JF, Vijayan MM. Bisphenol A in oocytes leads to growth suppression and altered stress performance in juvenile rainbow trout. PLoS One 5: e10741, 2010. doi:10.1371/journal.pone.0010741. - DOI - PMC - PubMed
    1. Babin PJ, Vernier JM. Plasma lipoproteins in fish. J Lipid Res 30: 467–489, 1989. - PubMed
    1. Barbier O, Trottier J, Kaeding J, Caron P, Verreault M. Lipid-activated transcription factors control bile acid glucuronidation. Mol Cell Biochem 326: 3–8, 2009. doi:10.1007/s11010-008-0001-5. - DOI - PubMed
    1. Bauermeister AE, Sargent JR. Biosynthesis of triacylglycerols in the intestines of rainbow trout (Salmo gairdnerii) fed marine zooplankton rich in wax esters. Biochim Biophys Acta 575: 358–364, 1979. doi:10.1016/0005-2760(79)90104-8. - DOI - PubMed

Publication types

MeSH terms

LinkOut - more resources