. 2018 Jul 3;19(7):598-608.
doi: 10.1080/15384047.2018.1449612. Epub 2018 Apr 13.

UFH-001 cells: A novel triple negative, CAIX-positive, human breast cancer model system

Affiliations

UFH-001 cells: A novel triple negative, CAIX-positive, human breast cancer model system

Zhijuan Chen et al. Cancer Biol Ther. .

Abstract

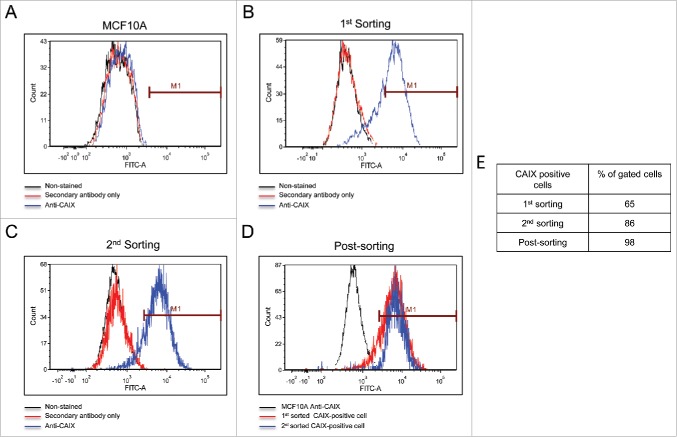
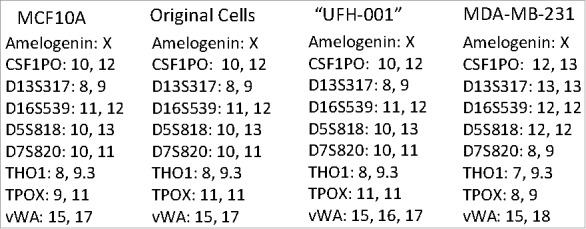
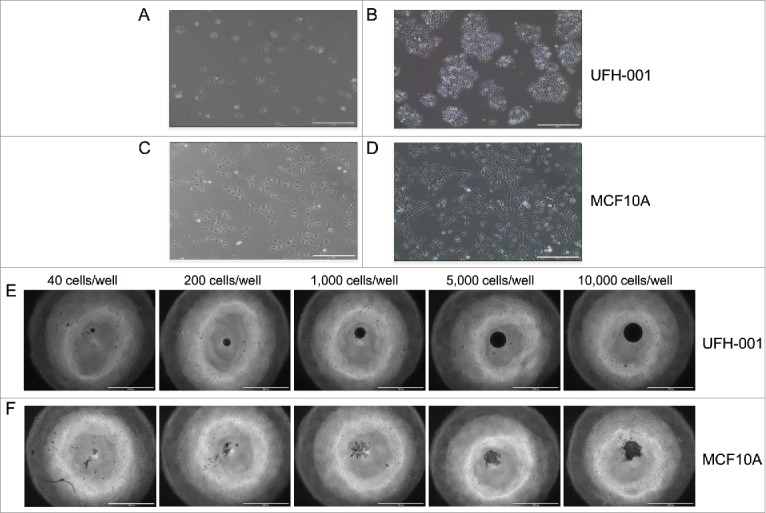
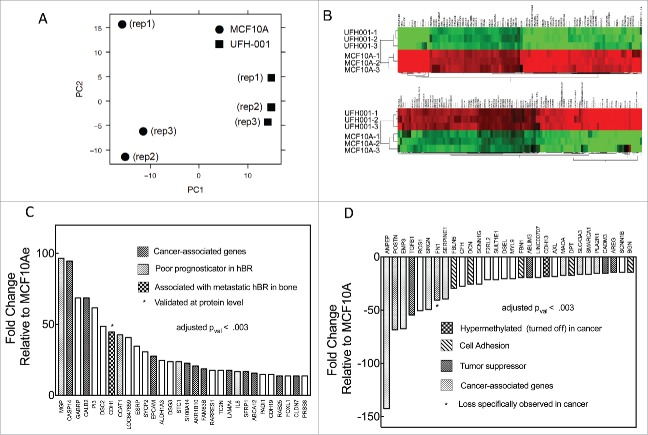
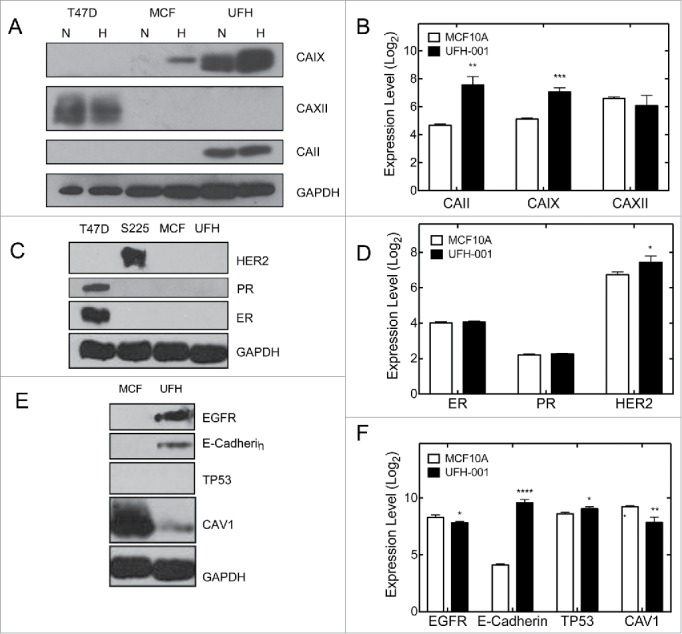
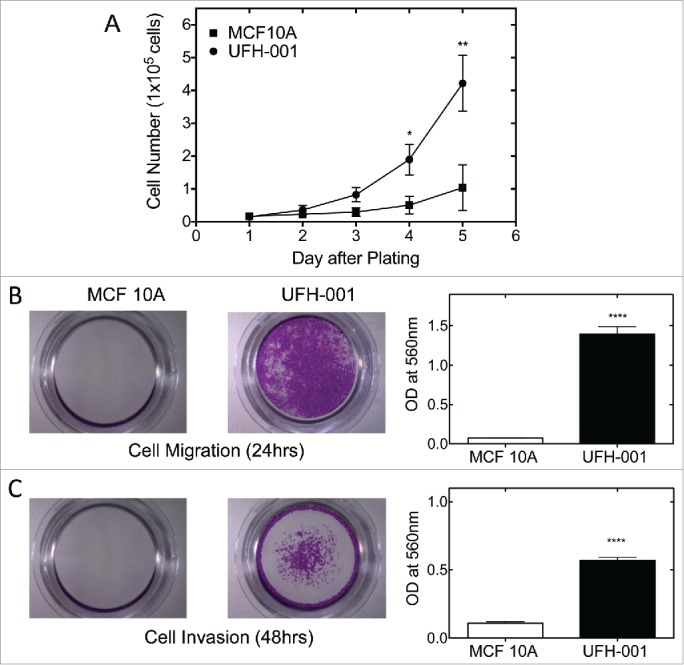
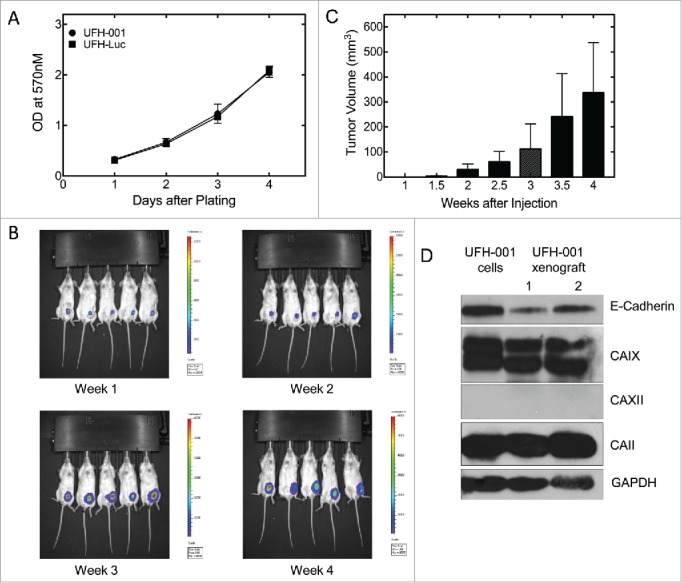
Human cell lines are an important resource for research, and are often used as in vitro models of human diseases. In response to the mandate that all cells should be authenticated, we discovered that the MDA-MB-231 cells that were in use in our lab, did not validate based on the alleles of 9 different markers (STR Profile). We had been using this line as a model of triple negative breast cancer (TNBC) that has the ability to form tumors in immuno-compromised mice. Based on marker analysis, these cells most closely resembled the MCF10A line, which are a near diploid and normal mammary epithelial line. Yet, the original cells express carbonic anhydrase IX (CAIX) both constitutively and in response to hypoxia and are features that likely drive the aggressive nature of these cells. Thus, we sought to sub-purify CAIX-expressing cells using Fluorescence Activated Cell Sorting (FACS). These studies have revealed a new line of cells that we have name UFH-001, which have the TNBC phenotype, are positive for CAIX expression, both constitutively and in response to hypoxia, and behave aggressively in vivo. These cells may be useful for exploring mechanisms that underlie progression, migration, and metastasis of this phenotype. In addition, constitutive expression of CAIX allows its evaluation as a therapeutic target, both in vivo and in vitro.

Keywords: Breast Biology; CAIX; Cancer Biology; Cancer Transcriptomes; STR profiling; UFH-001; breast cancer cells; cell sorting; microarray; triple negative model.


Figures

Figure 1.
Figure 1.
Isolation of CAIX-positive cells using flow cytometry. Panel A. Normoxic MCF10A cells served to identify CAIX-negative cells. The black line represents MCF10A cells that were not exposed to either primary antibody (the M75 monoclonal antibody) or the secondary mouse-specific IgG. The red line represents cells that were exposed to secondary antibody, only. The blue line represents cells that were exposed to both primary and secondary antibodies. Panel B. Separation of CAIX-positive from CAIX-negative cells in the original line. Color coding is the same as described in Panel A. CAIX-positive cells were gated and collected for expansion, representing the 1st sorting. Panel C. The expanded cells (from Panel B) were reanalyzed by flow cytometry for a 2nd sorting. Color coding is the same as described in Panel A. Panel D. Post-sorting analysis. Cells collected at the 2nd sorting were re-analyzed by flow cytometry for a final time and superimposed (blue line) on the gated cells from the 2nd sorting (red line) and CAIX-negative MCF10A cells (black line). Panel E. The table shows the % of gated cells at each step that are CAIX-positive.
Figure 2.
Figure 2.
STR analysis of original and UFH-001 cells compared to the ATCC STR marker profile of MCF10A and MDA-MB-231 cells. The Molecular Genomics Core at the Moffitt Cancer Center analyzed the original cells. The UFH-001 cells were analyzed by bioSYNTHESIS (first sorting) and by IDEXX BioResearch (second sorting) with identical results.
Figure 3.
Figure 3.
Morphology and spheroid formation of the UFH-001 and MCF10A cells. UFH-001 cells showed a cohesive cobblestone morphology and formed colonies at low (Panel A) and high (Panel B) density (see Methods and Material for details). MCF10A cells displayed an elongated and spindle-like appearance at low (Panel C) and high (Panel D) density. Magnification: 10X, scale bar: 400μM. UFH-001 cells formed circular and dense spheroids across all starting concentrations at 48 h (Panel E). MCF10A cells formed irregular spheroids and only at starting densities of 5,000 and 10,000 cells/well at 48 h (Panel F). The scale bar represents 1 mm. Magnification is 4X.
Figure 4.
Figure 4.
Microarray data. Panel A. Principal component analysis (PCA) of the microarray data. Panel B. Heat-map comparing microarray data of differentially expressed genes between UFH-001 and MCF10A cells (top 100 differentially- expressed genes are shown). Panel C. Top 30 up-regulated mRNA species (fold-change) in UFH-001 cells relative to MCF10A. Panel D. Top 30 down-regulated mRNA species (fold-change) in UFH-001 cells relative to MCF10A.
Figure 5.
Figure 5.
Selected markers for the TNBC phenotype. Panels A, C, and E are representative western blots. Panels B, D, and F show comparative mRNA expression based on Log2 scores of microarray data. T47D and Sum225 cells were used as positive controls in the western blots, where appropriate. The number of asterisks denotes the statistical significance between mRNA levels in UFH-001 and MCF10A cells: * p < 0.05, ** p<0.01, *** p < 0.001, **** p < 0.0001)
Figure 6.
Figure 6.
Proliferation, migration, and invasion of UFH-001 and MCF10A cells. Panel A. Cell growth curves of UFH-001 and MCF10A, plated at 15,000 cells/plate in 35 mm plates, were cultured over 5 days. Panel B. Representative images show the migration of UFH-001 and MCF10A cells in transwell plates. Panel C. Representative images show the invasive capacity of UFH-001 and MCF10A cells in transwell plates. * p < 0.05, ** p < 0.01, **** p < 0.0001).
Figure 7.
Figure 7.
Tumorigenicity of UFH-001 cells in NOD/SCID mice. Panel A. UFH-001 and UFH-Luc cells were grown in culture for four days. At each day an MTT assay was performed to evaluate cell proliferation. Panel B. UF-Luc cells were orthotopically implanted (3 × 10⁵ cells) into the first mammary gland of NOD/SCID mice, and evaluated by in vivo (see Materials and Methods). Panel C. Tumor size was quantified by calculating tumor volume twice a week after the injection of UFH-Luc cells. Luminescence followed similar trends as tumor volume except at 4 weeks where there was central necrosis that reduced luminescent readings (data not shown). Panel D. Samples of UFH-001 cells and tissue from UFH-Luc generated tumors were compared by western blotting.

References

    1. Hilvo M, Salzano AM, Innocenti A, Kulomaa MS, Scozzafava A, Scaloni A, Parkkila S, Supuran CT. Cloning, Expression, Post-Translational Modifications and Inhibition Studies on the Latest Mammalian Carbonic Anhydrase Isoform, CA XV. J Med Chem. 2009;52:646–54. doi: 10.1021/jm801267c. PMID:19193158. - DOI - PubMed
    1. Opavsky R, Pastorekova S, Zeln¡k V, Gibadulinov A, Stanbridge EJ, Z vada J, Kettmann R, Pastorek J. Human MN/CA9 Gene, A Novel Member of the Carbonic Anhydrase Family: Structure and Exon to Protein Domain Relationships. Genomics. 1996;33:480–7. doi: 10.1006/geno.1996.0223. PMID:8661007. - DOI - PubMed
    1. Li Y, Wang H, Tu C, Shiverick KT, Silverman DN, Frost SC. Role of Hypoxia and EGF on Expression, Activity, Localization, and Phosphorylation of Carbonic Anhydrase IX in MDA-MB-231 Breast Cancer Cells. Biochim Biophy Acta. 2011;1813:159–67. doi: 10.1016/j.bbamcr.2010.09.018. PMID:20920536. - DOI - PMC - PubMed
    1. Hilvo M, Baranauskiene L, Salzano AM, Scaloni A, Matulis D, Innocenti A, Scozzafava A, Monti SM, Di Fiore A, De Simone G, et al.. Biochemical Characterization of CA IX, One of the Most Active Carbonic Anhydrase Isozymes. J Biol Chem. 2008;283:27799–809. doi: 10.1074/jbc.M800938200. PMID:18703501. - DOI - PubMed
    1. Saarnio J, Parkkila S, Parkkila AK, Waheed A, Casey MC, Zhou XY, Pastorekova S, Pastorek J, Karttunen T, Haukipuro K, et al.. Immunohistochemistry of Carbonic Anhydrase Isozyme IX (MN/CA IX) in Human Gut Reveals Polarized Expression in Epithelial Cells with the Highest Proliferative Capacity. J Histochem Cytochem. 1998;46:497–504. doi: 10.1177/002215549804600409. PMID:9524195. - DOI - PubMed

Publication types