. 2018;13(4):363-375.
doi: 10.1080/15592294.2018.1454243. Epub 2018 May 3.

Chromium disrupts chromatin organization and CTCF access to its cognate sites in promoters of differentially expressed genes

Affiliations

Chromium disrupts chromatin organization and CTCF access to its cognate sites in promoters of differentially expressed genes

Andrew VonHandorf et al. Epigenetics. 2018.

Abstract

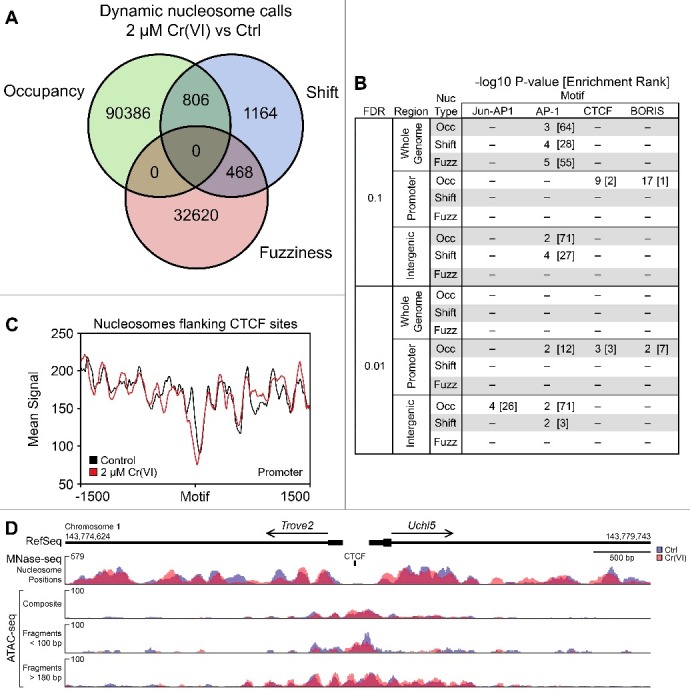
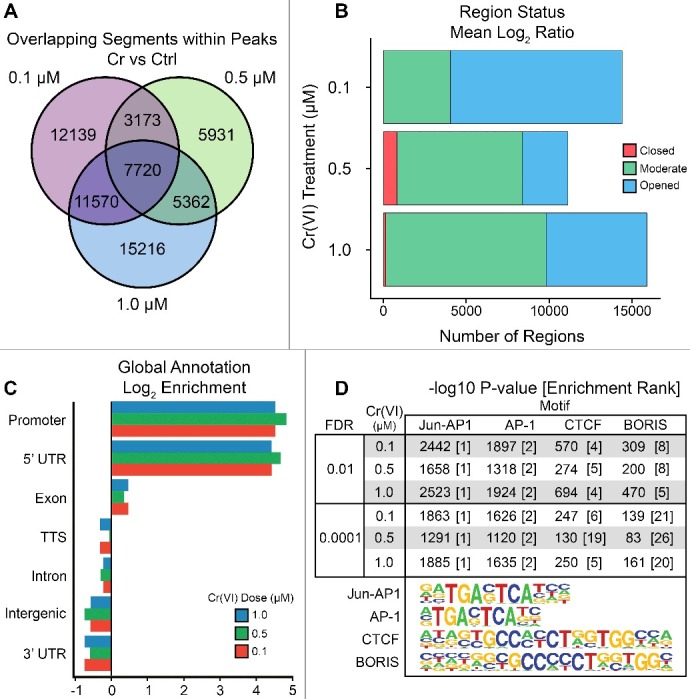
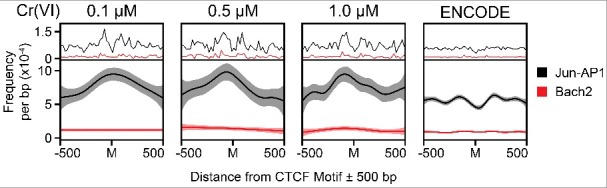
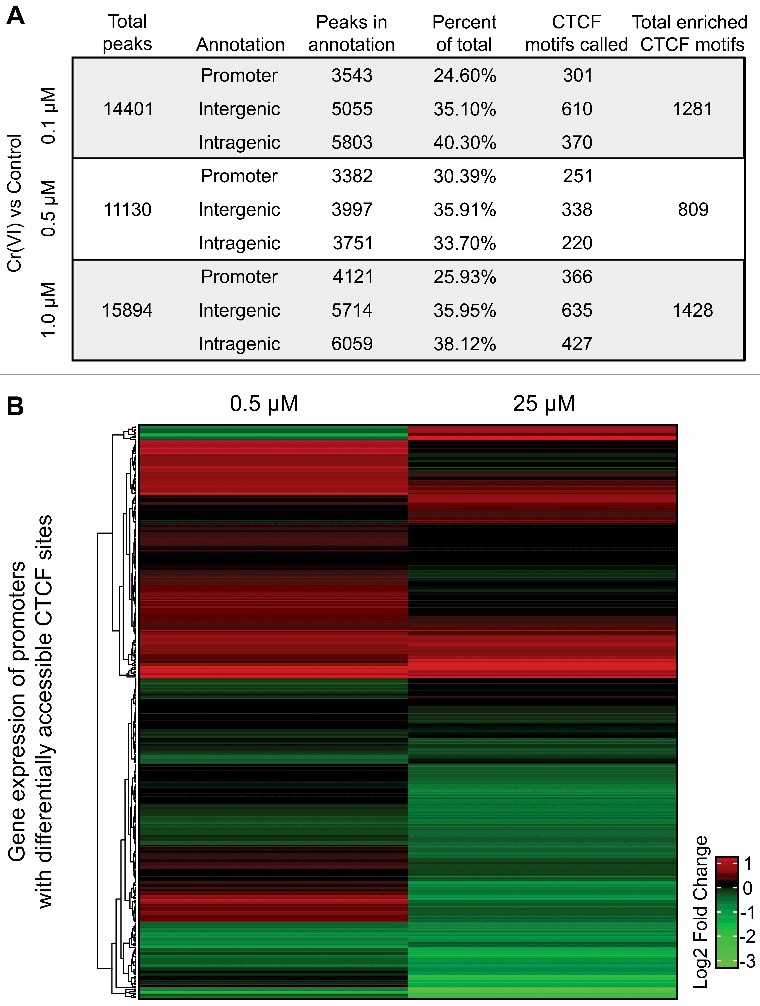
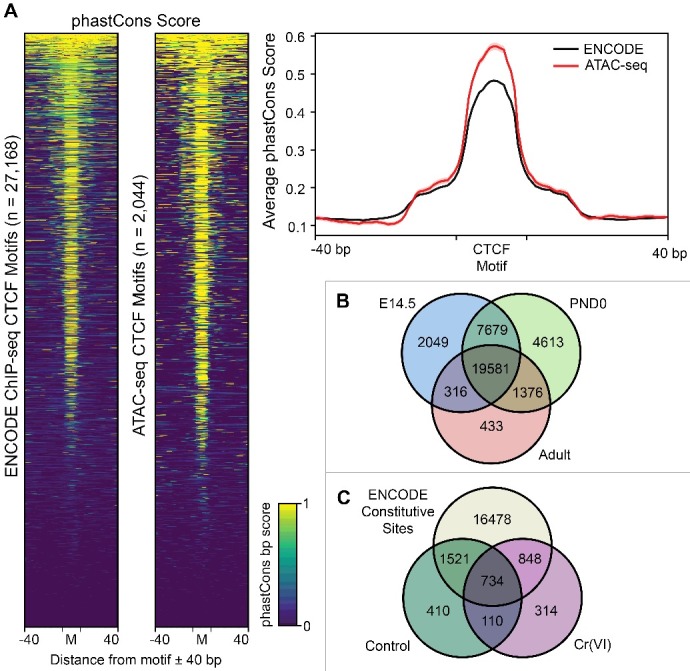
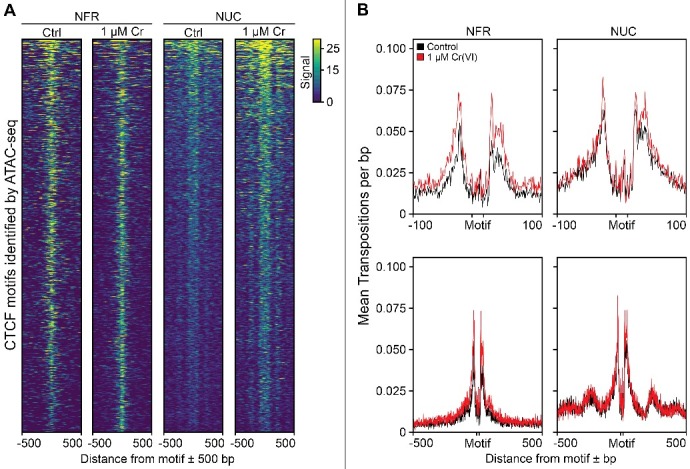
Hexavalent chromium compounds are well-established respiratory carcinogens used in industrial processes. While inhalation exposure constitutes an occupational risk affecting mostly chromium workers, environmental exposure from drinking water is a widespread gastrointestinal cancer risk, affecting millions of people throughout the world. Cr(VI) is genotoxic, forming protein-Cr-DNA adducts and silencing tumor suppressor genes, but its mechanism of action at the molecular level is poorly understood. Our prior work using FAIRE showed that Cr(VI) disrupted the binding of transcription factors CTCF and AP-1 to their cognate chromatin sites. Here, we used two complementary approaches to test the hypothesis that chromium perturbs chromatin organization and dynamics. DANPOS2 analyses of MNase-seq data identified several chromatin alterations induced by Cr(VI) affecting nucleosome architecture, including occupancy changes at specific genome locations; position shifts of 10 nucleotides or more; and changes in position amplitude or fuzziness. ATAC-seq analysis revealed that Cr(VI) disrupted the accessibility of chromatin regions enriched for CTCF and AP-1 binding motifs, with a significant co-occurrence of binding sites for both factors in the same region. Cr(VI)-enriched CTCF sites were confirmed by ChIP-seq and found to correlate with evolutionarily conserved sites occupied by CTCF in vivo, as determined by comparison with ENCODE-validated CTCF datasets from mouse liver. In addition, more than 30% of the Cr(VI)-enriched CTCF sites were located in promoters of genes differentially expressed from chromium treatment. Our results support the conclusion that Cr(VI) exposure promotes broad changes in chromatin accessibility and suggest that the subsequent effects on transcription regulation may result from disruption of CTCF binding and nucleosome spacing, implicating transcription regulatory mechanisms as primary Cr(VI) targets.

Keywords: ATAC-seq; CTCF; chromatin organization; hexavalent chromium; nucleosome architecture; transcription.


Figures

Figure 1.
Figure 1.
Occupancy of dynamic nucleosomes in promoter regions affects CTCF motif accessibility. Hepa-1c1c7 cells were treated with either H2O or 2 µM K2CrO4 for 72 hours before collection and monosome preparation by MNase digestion. (A) Represents dynamic nucleosomes that were called with the DaNPOS2 toolkit [34] with a threshold of q = 0.01. (B) Dynamic nucleosomes were analyzed for motif enrichment using HOMER [35] and separated based on genomic annotation at two different thresholds, q = 0.1 and q = 0.01. Enriched motifs are provided as the -log10 P value of the known motif, with its rank compared to other motifs listed in brackets. (C) CTCF motifs identified in promoters based on changes in nucleosome occupancy were extracted and motif orientation was corrected using previous annotations prior to generating average signal plots of nucleosome positions with deepTools2 Suite [57]. (D) The bidirectional promoter region between Trove2 and Uchl5 is provided to illustrate the complementarity between different sequencing techniques. Signal tracks in blue (control) and red (Cr-treated) represent either the nucleosome position generated using MNase-seq (upper panel) or ATAC-seq insert signal (lower panels). ATAC-seq tracks are represented using three separate criteria; “composite” is the average signal recorded for each bp with no insert-size filtering, while the middle track represents short inserts (less than 100 bp in length), and the lowest nucleosome-spanning inserts (greater than 180 bp in length).
Figure 2.
Figure 2.
ATAC-seq identifies changes in chromatin accessibility associated with Cr(VI) exposure. Hepa-1c1c7 cells were treated with 0.1, 0.5, and 1.0 µM of K2CrO4 for 72 hours followed by nuclei isolation and addition of the Tn5-transposition reaction. (A) Differentially accessible peaks were called against an untreated control using MACS2 [52] with a threshold of q = 0.0001 and overlaps were calculated using the multiIntersectBed command in the Bedtools Suite [53]. The total number of input peaks for each treatment were 14,401, 11,130, and 15,894 for Cr 0.1, 0.5, and 1.0 µM prior to measuring the intersections. (B) Normalized log2 signal tracks comparing treated and control were generated using deepTools2 [57] with a bin size of 50 bp. Mean signal values were measured across normalized peak distances set to 1,000 bp for their respective treatments. Regions were considered to be significantly opened or closed following treatment if the mean was R ≥ 0.5 or R ≤ −0.5, respectively. (C-D) Each set of differentially accessible peaks was analyzed using HOMER [35] for annotation statistics and identification of significantly enriched motifs, listed as the –log10 P value of the known motif for ease of description [35]. The rank of enrichment for each motif logo is provided in brackets.
Figure 3.
Figure 3.
Proximal regions surrounding differentially accessible CTCF sites exhibit increased AP-1 motif density. CTCF sites were extracted from each set of differentially accessible peaks and subsequently used to measure the density of AP-1, Jun-AP1 and BACH2 motifs relative to each site ± 500 bp using HOMER [35]. The top panel represents the average frequency score for each motif in 20-bp bins. The panel below shows a smoothed model for the same data, generated using the smooth feature and generalized additive model method in ggplot2 [65] with no specified bin size. Jun-AP1 and AP-1 exhibit very similar trends among all conditions, thus only the Jun-AP1 results are shown. The number of CTCF sites represented in each graph from left to right is 1,354; 862; 1,525; and 21,901 respectively. ENCODE motif locations were derived from the adult CTCF ChIP-seq data, ENCSR000CBU.
Figure 4.
Figure 4.
Differentially accessible CTCF motifs in promoters are associated with changes in expression. (A) The table describes the annotation statistics and CTCF enrichment analysis from HOMER [35]. Peaks were separated into “Promoter”, “Intergenic”, or “Intragenic” and compared to the total number of differentially accessible regions per treatment to estimate the percentage of peaks in each category. Additionally, the sum of peaks per category that contained one or more CTCF motifs are provided. (B) Peaks positive for the CTCF motif within ±1.5 Kb of a transcriptional start site (TSS) were selected and the closest gene ID was used to generate a list of 923 potential genes of interest. These were filtered to remove duplicate genes called by each treatment resulting in a total of 445 unique genes (see Supplemental Table 3). The log2 fold change values from previously published RNA-Seq datasets using doses of 0.5 µM or 25 µM K2CrO4 were used to assess changes in transcription for the filtered set of genes [23,33]; 400 of the 445 genes were annotated with expression values and each condition was independently analyzed back to controls in its respective experiment.
Figure 5.
Figure 5.
CTCF sites with altered accessibility are conserved, functional sites in the mouse liver. (A) The locations of CTCF motifs (20 bp sites) within each set of peaks was determined using HOMER [35], then pooled and subsequently filtered for unique values to generate a comprehensive list of CTCF sites affected by Cr(VI) treatment. DeepTools257 was used to compute the conservation scores in the mm10 phastCons bigwig file for each motif and its surrounding region ±40 bp. Regions with no value were not included. The summary plot represents the mean phastCons score per bp. (B) Conservative, IDR-thresholded peak files from three mouse liver CTCF ChIP studies in ENCODE were obtained and scanned for the same 20 bp CTCF motif (Find accession numbers in Supplemental Table 1) [61,62]. Locations were extracted and measured for overlap as previously described. (C) de novo motif locations called in a separate ChIP-Seq experiment using 25 µM Cr(VI) were compared for overlapping sites in the core, common set of ENCODE-derived motifs (19,581).
Figure 6.
Figure 6.
Cr(VI) disrupts normal chromatin accessibility profiles. Bigwig files representing the enrichment of nucleosome free regions (NFR) and nucleosome-traversing (NUC) insertions were generated from bam files using deepTools257. Fragments less than 100 bp were considered as nucleosome free regions (NFR, ∼7-12 M reads) and those greater than 180 bp were considered as nucleosome-traversing (NUC, ∼12-16 M reads), based on previously established cutoffs [37]. Following allocation, signal tracks were normalized to 1X sequencing depth. (A) The signal surrounding 1,524 differentially accessible CTCF motifs in the 1 µM Cr(VI) treatment compared to control was calculated using a bin size of 10 bp for the motif ± 500 bp, then plotted as a heatmap to examine trends. (B) Atactk [60] was used to calculate the mean transpositions per bp surrounding CTCF motifs identified in the 1 µM Cr(VI) treatment. Control and treated bam files were queried using CTCF motifs allocated based on their orientation and subsequently corrected to provide a single, forward-facing orientation. Each bam file was tested using two separate bin criteria at single base-pair resolution (run simultaneously), noted as NFR (1-100 bp) and NUC (180-1,000 bp). Positive and negative strand cut-point values were summed and subsequently used to calculate a mean cut point value based on their initial means.

Similar articles

Cited by

References

    1. Kondo K, Takahashi Y, Hirose Y, et al. The reduced expression and aberrant methylation of p16(INK4a) in chromate workers with lung cancer. Lung Cancer. 2006;53:295–302. doi: 10.1016/j.lungcan.2006.05.022. PMID:16828922 - DOI - PubMed
    1. Park RM, Bena JF, Stayner LT, et al. Hexavalent chromium and lung cancer in the chromate industry: a quantitative risk assessment. Risk Anal. 2004;24:1099–1108. doi: 10.1111/j.0272-4332.2004.00512.x. PMID:15563281 - DOI - PubMed
    1. Wilbur S, Abadin H, Fay M, et al. Toxicological profile for chromium. Atlanta: (GA: ): ATSDR, CDC; 2012. - PubMed
    1. Costa M, Klein CB. Toxicity and carcinogenicity of chromium compounds in humans. Crit Rev Toxicol. 2006;36:155–163. doi: 10.1080/10408440500534032. PMID:16736941 - DOI - PubMed
    1. National Toxicology P Toxicology and carcinogenesis studies of sodium dichromate dihydrate (Cas No. 7789-12-0) in F344/N rats and B6C3F1 mice (drinking water studies). Natl Toxicol Program Tech Rep Ser. 2008:1–192. - PubMed

Publication types

MeSH terms