. 2018 Mar 21:7:e34861.
doi: 10.7554/eLife.34861.

Capillary pericytes express α-smooth muscle actin, which requires prevention of filamentous-actin depolymerization for detection

Affiliations

Capillary pericytes express α-smooth muscle actin, which requires prevention of filamentous-actin depolymerization for detection

Luis Alarcon-Martinez et al. Elife. .

Abstract

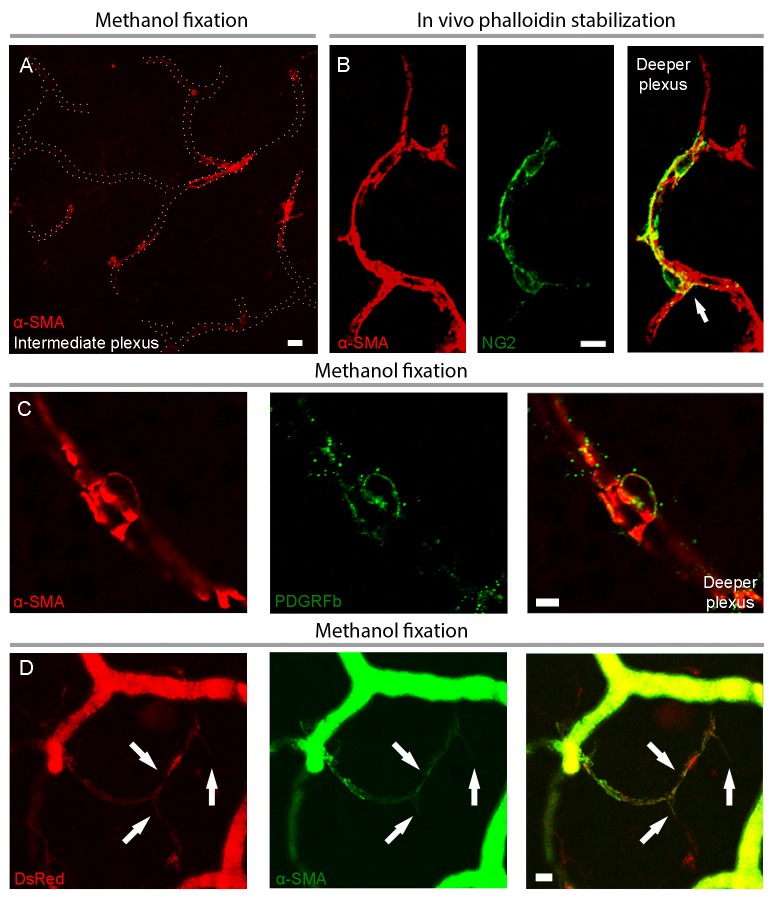
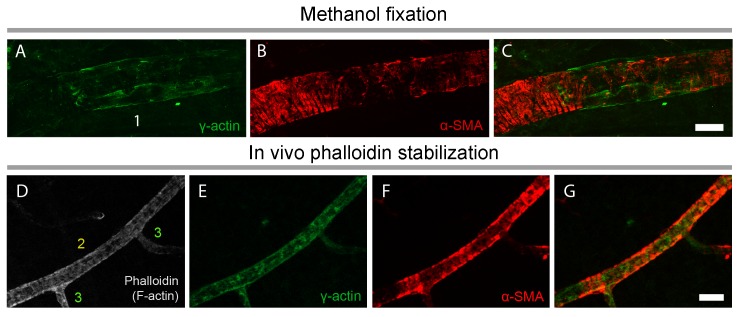
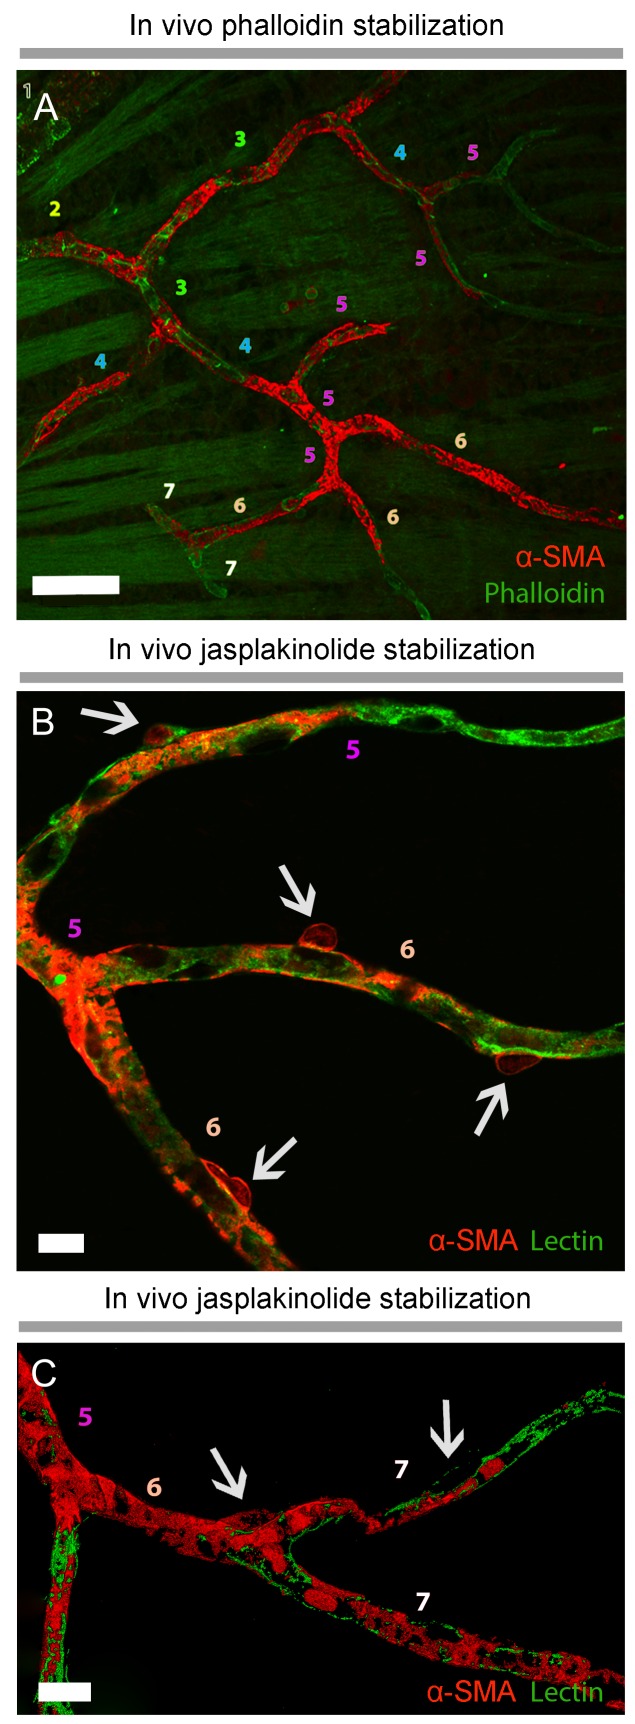
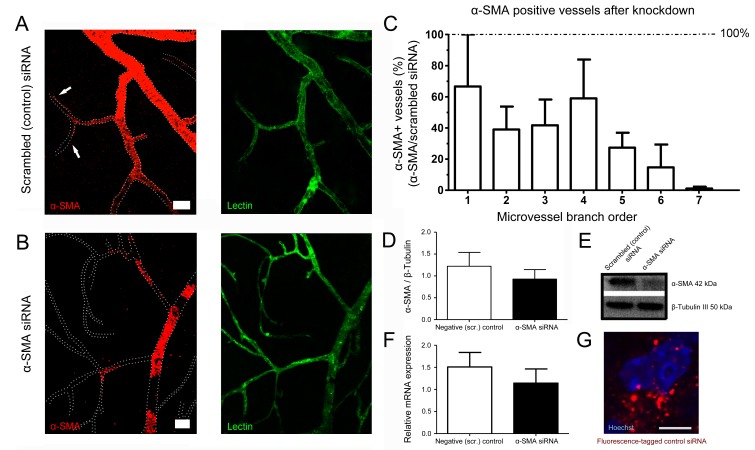
Recent evidence suggests that capillary pericytes are contractile and play a crucial role in the regulation of microcirculation. However, failure to detect components of the contractile apparatus in capillary pericytes, most notably α-smooth muscle actin (α-SMA), has questioned these findings. Using strategies that allow rapid filamentous-actin (F-actin) fixation (i.e. snap freeze fixation with methanol at -20°C) or prevent F-actin depolymerization (i.e. with F-actin stabilizing agents), we demonstrate that pericytes on mouse retinal capillaries, including those in intermediate and deeper plexus, express α-SMA. Junctional pericytes were more frequently α-SMA-positive relative to pericytes on linear capillary segments. Intravitreal administration of short interfering RNA (α-SMA-siRNA) suppressed α-SMA expression preferentially in high order branch capillary pericytes, confirming the existence of a smaller pool of α-SMA in distal capillary pericytes that is quickly lost by depolymerization. We conclude that capillary pericytes do express α-SMA, which rapidly depolymerizes during tissue fixation thus evading detection by immunolabeling.

Keywords: F-actin; alpha-smooth muscle actin; capillary; mouse; neuroscience; retinal pericytes.


Conflict of interest statement

LA, SY, MY, JS, KK, AC, AD, TD No competing interests declared

Figures

Figure 1.
Figure 1.. α-smooth-muscle actin expression in retinal capillary pericytes can be visualized after rapid tissue fixation or inhibition of actin depolymerization.
(A–C) The panoramic montage of confocal images of whole–mount retinas illustrate α-SMA immunolabeling of the retinal vessels after PFA (A) or −20°C methanol fixation (B), or using specific F-actin fixing agent, jasplakinolide (C). Each microvessel is numbered corresponding to its branching order. Insets show the microvessels in the boxed areas in detail. Faster fixation of retinas with methanol at −20o or inhibition of actin depolymerization shows clear α-SMA immunoreactivity (red fluorescence) in sixth order microvessels, whereas with PFA fixation, α-SMA expression could be visualized only down to fourth order branches. Scale bars, 40 μm.
Figure 1—figure supplement 1.
Figure 1—figure supplement 1.. F-actin expression in capillary pericytes after PFA fixation.
(A–D) F-actin identified with fluorescent-tagged phalloidin (red, B, D) co-localized with pericyte soma (arrowhead) and processes (arrows) on the abluminal side of seventh order capillaries labeled with lectin (white, (A, C,) arrows). Scale bar in A,B: 10 um; scale bar in C,D: 5 μm.
Figure 1—figure supplement 2.
Figure 1—figure supplement 2.. The effect of methanol was not due to a nonspecific action like protein denaturation.
Retinas fixed with another alcohol, ethanol (A) did not disclose the α-SMA immunostaining in higher order microvessels contrary to the methanol fixation (B). Panoramic pictures of the retina were generated by tiling individual 40x-pictures. Scale bars: 40 μm.
Figure 2.
Figure 2.. Capillary pericytes in intermediate and deeper retinal layers express α-SMA.
(A) α-SMA expression in the intermediate plexus capillaries after methanol fixation. Note circular pattern of α-SMA staining wrapping a capillary in a junctional pericyte (see the Figure 2—video 1 for z-stacks of this image). Scale bar: 10 μm. (B) Prevention of α-SMA depolymerization in vivo with phalloidin treatment revealed robust α-SMA expression in NG2 positive pericytes also on the deeper plexus capillaries. Note circular α-SMA staining in junctional pericytes, wrapping the capillary wall (arrow). Scale bar: 10 μm. (C) Colocalization of α-SMA with PDGFRβ immunoreactivity in a deeper plexus capillary pericyte. Scale bar: 5 μm. D) Colocalization of α-SMA immunoreactivity with DsRed fluorescence in several deeper plexus capillary pericytes (arrows) in a retina from an NG2-DsRed transgenic mouse. The focus was adjusted to visualize the deep layer in this image; hence the superficial vessels lack morphological details and appear diffuse. C and D were captured from retinas fixed with methanol. Scale bar: 10 μm.
Figure 2—figure supplement 1.
Figure 2—figure supplement 1.. Negative control for anti-α-SMA immunostaining.
(A–B) After preventing F-actin depolymerization with phalloidin, immunoreactivity was not detected (A) if the α-SMA primary antibody was omitted on microvessels identified with lectin (B).
Figure 3.
Figure 3.. Quantification of α-SMA-positive capillary pericytes by vessel order, fixation method and retinal layers.
(A) Number of α-SMA-positive vessels per retina by the branching order. α-SMA immunostaining was mainly limited to the first four order vessels after PFA fixation (n = 6). In contrast, methanol fixation (n = 5) and phalloidin (n = 5) or jasplakinolide stabilization (n = 3) allowed visualization of α-SMA expression in downstream branches (p<0.05; ANOVA followed by Dunnett’s test). Phalloidin and jasplakinolide were especially effective in revealing α-SMA expression in 7th order capillaries, suggesting that their small α-SMA pool rapidly depolymerizes during tissue processing (p=0.002, ANOVA followed by Dunnett’s test). (B) Total number of NG2 as well as α-SMA + microvessels on each whole-mount retina detected with different fixation methods (PFA: n = 3, 509 ± 30.5 pericytes; methanol: n = 3, 883 ± 56.1 pericytes; phalloidin: n = 3, 890 ± 138.2 pericytes, p=0.035; ANOVA followed by Dunnett’s test). (C) Illustrates the number of α-SMA-positive pericytes for each retinal vascular plexus. Methanol, phalloidin and jasplakinolide were effective in disclosing α-SMA expression in pericytes located in intermediate plexus (PFA: n = 3, 97 ± 22.7 vs. methanol: n = 3, 424 ± 71.6, phalloidin: n = 3, 509 ± 78.5, jasplakinolide: n = 3, 497 ± 99.5 pericytes respectively, p=0.03; ANOVA followed by Dunnett’s test), and especially, phalloidin and jasplakinolide were effective to disclose within the deeper plexus (PFA: n = 3, 4 ± 2.7 vs. methanol: n = 3, 119 ± 27.2, phalloidin: n = 3, 260 ± 29.8, jasplakinolide: n = 3, 359 ± 95.7 pericytes respectively, p=0.01; ANOVA followed by Dunnett’s test). (D) Illustrates the percentage of α-SMA-positive to total DsRed-NG2-positive pericytes for each retinal vascular plexus in DsRed mice (PFA: n = 3, superficial, intermediate, and deeper: 75.7%, 10.4%, 0.4%; methanol: n = 3, 85.1%, 45.8%, 12.5%; phalloidin: n = 3, 87.9%, 54.9%, 27.3%; jasplakinolide: n = 3, 78.7%, 60.4%, 55.0%). *p≤0.05. (Meth: methanol at −20°C; Phall: Phalloidin, Jaspl: Jasplakinolide, interm: intermediate, superf: superficial).
Figure 4.
Figure 4.. γ-actin immunostaining has a distinct pattern than α-SMA immunostaining.
(A–C) γ-actin immunostaining (green) ran longitudinally parallel to the pericyte plasma membrane unlike α-SMA, which showed a circular immunostaining pattern outlining the pericyte processes around the capillaries (red). F-actin fixation with methanol (A–C) or phalloidin (fluorescent-tagged, gray, D) did not change γ-actin and α-SMA distribution in vessels (E–G). Phalloidin was injected into vitreous 2 hr before sacrificing the mouse. Despite phalloidin stabilization of F-actin filaments, γ-actin remained detectable only ≤4th order branches unlike α-SMA. Scale bars: 20 µm.
Figure 5.
Figure 5.. Prevention of α-SMA depolymerization in vivo with phalloidin or jasplakinolide revealed further α-SMA immunolabeling in high order retinal capillaries.
(A), Phalloidin, intravitreally injected for preventing F-actin depolymerization in vivo, was fluorescent-tagged (green) and revealed α-SMA immunolabeling (red) in 6th and 7th order retinal capillaries on whole-mount retinas ex vivo. Scale bar: 40 μm. (B–C) F-actin stabilization in vivo with Jasplakinolide also disclosed α-SMA immunolabeling (red) in 6th and 7th order retinal capillaries, which were visualized with lectin (green). Arrows point to pericyte somas and numbers indicate the branch order. Image in C is surface rendered image. Scale bars: 10 μm.
Figure 6.
Figure 6.. α-SMA knockdown by siRNA reduced α-SMA expression.
(A–B) α-SMA knockdown by siRNA reduced α-SMA expression, being more effective on capillary pericytes (B) and only partially effective on more proximal microvessels. Scrambled (control) siRNA had no effect on α-SMA expression (A). Note the α-SMA immunostaining extending down to high-order microvessels in A (arrows). All retinas were fixed with methanol snap freezing. Scale bars in A, B = 20 μm. (C) Illustrates the ratio of microvessels with intact α-SMA immunolabeling in α-SMA-siRNA injected retinas to scrambled (control) siRNA-injected retinas (n = 3 per group). The inhibition trend being more prominent on high order branches was statistically significant (p=0.005) with non-parametric Jonckheere-terpstra test for trend analysis. (D–F) Western blotting (D–E) (scrambled-siRNA, n = 3, 1.22 ± 0.32 a.u.; α-SMA-siRNA, n = 3, 0.93 ± 0.23 a.u., p=0.4; Student’s t-test) and qRT-PCR (F) (scrambled-siRNA, n = 3, 1.51 ± 0.33 a.u.; α-SMA-siRNA, n = 3, 1.14 ± 0.32 a.u., p=0.7; Student’s t-test) show that both α-SMA protein and α-SMA-mRNA levels were reduced in α-SMA-siRNA injected retinas but the difference did not reach statistical significance possibly because the large amounts of α-SMA in proximal microvessels masked the inhibition in high order branches with small pools of α-SMA. (G) Illustrates the fluorescence-tagged control siRNA distributed in the retina 48 hr after injection (red). Hoechst staining identifies the nuclei. Scale bar, 5 µm. (Scr.: scrambled).

References

    1. Alarcón-Martínez L, Avilés-Trigueros M, Galindo-Romero C, Valiente-Soriano J, Agudo-Barriuso M, Villa PL, Villegas-Pérez MP, Vidal-Sanz M. ERG changes in albino and pigmented mice after optic nerve transection. Vision Research. 2010;50:2176–2187. doi: 10.1016/j.visres.2010.08.014. - DOI - PubMed
    1. Armulik A, Genové G, Betsholtz C. Pericytes: developmental, physiological, and pathological perspectives, problems, and promises. Developmental Cell. 2011;21:193–215. doi: 10.1016/j.devcel.2011.07.001. - DOI - PubMed
    1. Arnold TD, Ferrero GM, Qiu H, Phan IT, Akhurst RJ, Huang EJ, Reichardt LF. Defective retinal vascular endothelial cell development as a consequence of impaired integrin αVβ8-mediated activation of transforming growth factor-β. Journal of Neuroscience. 2012;32:1197–1206. doi: 10.1523/JNEUROSCI.5648-11.2012. - DOI - PMC - PubMed
    1. Auinger S, Small JV. Correlated light and electron microscopy of the cytoskeleton. Methods in Cell Biology. 2008;88:257–272. doi: 10.1016/S0091-679X(08)00414-7. - DOI - PubMed
    1. Bandopadhyay R, Orte C, Lawrenson JG, Reid AR, De Silva S, Allt G. Contractile proteins in pericytes at the blood-brain and blood-retinal barriers. Journal of Neurocytology. 2001;30:35–44. doi: 10.1023/A:1011965307612. - DOI - PubMed

Publication types