. 2018 Mar 21;13(3):e0190557.
doi: 10.1371/journal.pone.0190557. eCollection 2018.

Projected avifaunal responses to climate change across the U.S. National Park System

Affiliations

Projected avifaunal responses to climate change across the U.S. National Park System

Joanna X Wu et al. PLoS One. .

Abstract

Birds in U.S. national parks find strong protection from many longstanding and pervasive threats, but remain highly exposed to effects of ongoing climate change. To understand how climate change is likely to alter bird communities in parks, we used species distribution models relating North American Breeding Bird Survey (summer) and Audubon Christmas Bird Count (winter) observations to climate data from the early 2000s and projected to 2041-2070 (hereafter, mid-century) under high and low greenhouse gas concentration trajectories, RCP8.5 and RCP2.6. We analyzed climate suitability projections over time for 513 species across 274 national parks, classifying them as improving, worsening, stable, potential colonization, and potential extirpation. U.S. national parks are projected to become increasingly important for birds in the coming decades as potential colonizations exceed extirpations in 62-100% of parks, with an average ratio of potential colonizations to extirpations of 4.1 in winter and 1.4 in summer under RCP8.5. Average species turnover is 23% in both summer and winter under RCP8.5. Species turnover (Bray-Curtis) and potential colonization and extirpation rates are positively correlated with latitude in the contiguous 48 states. Parks in the Midwest and Northeast are expected to see particularly high rates of change. All patterns are more extreme under RCP8.5 than under RCP2.6. Based on the ratio of potential colonization and extirpation, parks were classified into overall trend groups associated with specific climate-informed conservation strategies. Substantial change to bird and ecological communities is anticipated in coming decades, and current thinking suggests managing towards a forward-looking concept of ecological integrity that accepts change and novel ecological conditions, rather than focusing management goals exclusively on maintaining or restoring a static set of historical conditions.


Conflict of interest statement

Competing Interests: The authors have declared that no competing interests exist.

Figures

Fig 1
Fig 1. Projected species turnover from the early 2000s to mid-century across seven NPS geographic regions and 274 U.S. national parks.
Bray-Curtis turnover rates under RCP8.5 are calculated under the assumption that all potential extirpations and colonizations are realized, with 0 being no change and 1 being complete turnover. Circle sizes represent rates in summer, and colors represent rates in winter. Breaks in classes are based on quartiles. Alaska is shown in the inset on the left and the National Capital region is shown in the inset on the right. The chart on the right shows the mean and standard error of the mean turnover index by NPS geographic region, and the dotted lines show the mean turnover index across regions in both summer (0.23 ± SE 0.004) and winter (0.23 ± 0.006). Analysis of variance indicated significant difference among regions in summer (F(6, 267) = 13.96, p < 0.0001) and winter (F(6, 267) = 26.25, p < 0.001).
Fig 2
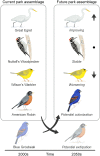
Fig 2. Example of projected bird assemblage changes by mid-century at Golden Gate National Recreation Area.
Under RCP8.5 in summer, climate suitability is projected to improve for the Great Egret (Ardea alba), remain stable for the Nuttall’s Woodpecker (Picoides nuttallii), and worsen for the Wilson’s Warbler (Cardellina pusilla). Climate suitability is at risk of disappearing for the American Robin (Turdus migratorius), potentially resulting in extirpation from the park. Although the Blue Grosbeak (Passerina caerulea) is not currently found in the park, climate is projected to become suitable for this species, potentially resulting in local colonization. Bird illustrations by Kenn Kaufman.
Fig 3
Fig 3. Classification of 274 U.S. national parks into trend groups based on the proportion of potential colonizations and extirpations.
Each circle represents a park. The median proportion of colonizations and extirpations across parks under RCP8.5 in summer (represented by solid vertical and horizontal lines in the plot) were used to classify parks into all trend groups except intermediate change. The upper and lower quartiles of each axis (represented by the diamond in the center of the plot) mark the boundaries of the intermediate change group. Alaska is shown in the inset on the left and the National Capital region is shown in the inset on the right.
Fig 4
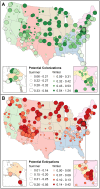
Fig 4. Projected species composition changes from the early 2000s to mid-century across 274 U.S. national parks.
Potential (A) colonizations and (B) extirpations in summer and winter under RCP8.5 are shown as a proportion of the current total number of species. Circle sizes represent proportions in summer, and colors represent proportions in winter. Breaks in classes are based on quartiles. Alaska is shown in the inset on the left and the National Capital region is shown in the inset on the right.
Fig 5
Fig 5. Relationships of the proportion of potential colonizations, extirpations, and turnover rate to latitude.
Rates/proportions between the present and mid-century under RCP8.5 in summer and winter. Significance of the regression fit is denoted by “***” where p < 0.001, and r2 values are shown next to each curve where significant.

References

    1. U.S. Congress. The National Park Service Organic Act. National Park Service, 39 Stat. 535, 16 U.S.C. Sect. 1–4 1916.
    1. Wade AA, Hand BK, Kovach RP, Muhlfeld CC, Waples RS, Luikart G. Assessments of species’ vulnerability to climate change: from pseudo to science. Biodivers Conserv. 2016; 1–7.
    1. Monahan WB, Fisichelli NA. Climate exposure of US national parks in a new era of change. PLoS ONE. 2014;9: e101302 doi: 10.1371/journal.pone.0101302 - DOI - PMC - PubMed
    1. Fisichelli NA, Schuurman GW, Hoffman CH. Is ‘resilience’ maladaptive? Towards an accurate lexicon for climate change adaptation. Environ Manage. 2016;57: 753–758. doi: 10.1007/s00267-015-0650-6 - DOI - PMC - PubMed
    1. Langdon JG, Lawler JJ. Assessing the impacts of projected climate change on biodiversity in the protected areas of western North America. Ecosphere. 2015;6: art87.

Publication types