

Development and validation of a physiology-based model for the prediction of pharmacokinetics/toxicokinetics in rabbits
- PMID: 29561908
- PMCID: PMC5862475
- DOI: 10.1371/journal.pone.0194294
Development and validation of a physiology-based model for the prediction of pharmacokinetics/toxicokinetics in rabbits
Abstract
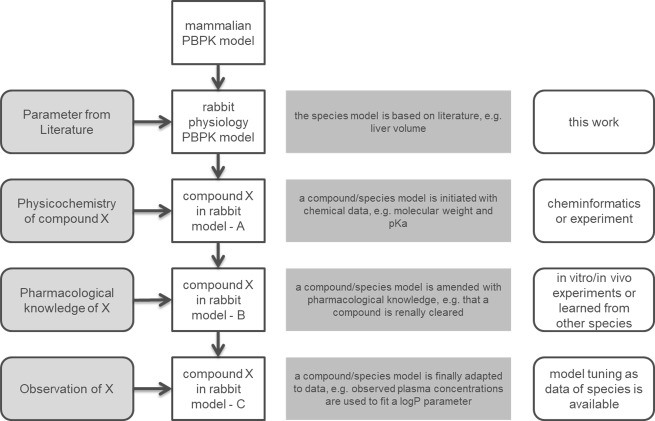
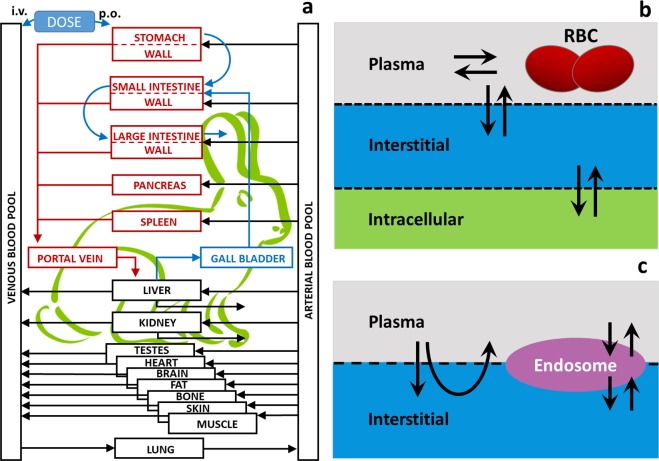
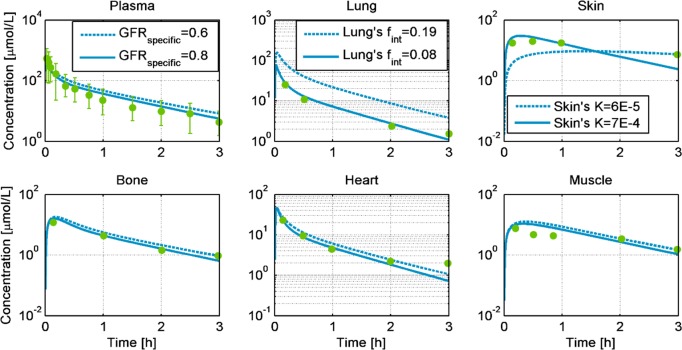
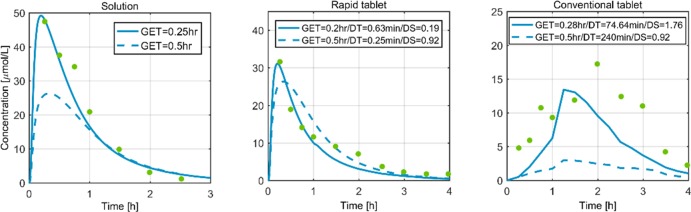
The environmental fates of pharmaceuticals and the effects of crop protection products on non-target species are subjects that are undergoing intense review. Since measuring the concentrations and effects of xenobiotics on all affected species under all conceivable scenarios is not feasible, standard laboratory animals such as rabbits are tested, and the observed adverse effects are translated to focal species for environmental risk assessments. In that respect, mathematical modelling is becoming increasingly important for evaluating the consequences of pesticides in untested scenarios. In particular, physiologically based pharmacokinetic/toxicokinetic (PBPK/TK) modelling is a well-established methodology used to predict tissue concentrations based on the absorption, distribution, metabolism and excretion of drugs and toxicants. In the present work, a rabbit PBPK/TK model is developed and evaluated with data available from the literature. The model predictions include scenarios of both intravenous (i.v.) and oral (p.o.) administration of small and large compounds. The presented rabbit PBPK/TK model predicts the pharmacokinetics (Cmax, AUC) of the tested compounds with an average 1.7-fold error. This result indicates a good predictive capacity of the model, which enables its use for risk assessment modelling and simulations.
Conflict of interest statement
Figures
Similar articles
-
Improved Human Pharmacokinetic Prediction of Hepatically Metabolized Drugs With Species-Specific Systemic Clearance.J Pharm Sci. 2018 May;107(5):1443-1453. doi: 10.1016/j.xphs.2017.12.027. Epub 2018 Jan 10. J Pharm Sci. 2018. PMID: 29331382
-
In silico predictions of the human pharmacokinetics/toxicokinetics of 65 chemicals from various classes using conformal prediction methodology.Xenobiotica. 2022 Feb;52(2):113-118. doi: 10.1080/00498254.2022.2049397. Epub 2022 Mar 16. Xenobiotica. 2022. PMID: 35238270
-
A stochastic whole-body physiologically based pharmacokinetic model to assess the impact of inter-individual variability on tissue dosimetry over the human lifespan.Regul Toxicol Pharmacol. 2010 Jun;57(1):103-16. doi: 10.1016/j.yrtph.2010.01.005. Epub 2010 Feb 1. Regul Toxicol Pharmacol. 2010. PMID: 20122977
-
Physiologically based pharmacokinetics (PBPK).Drug Metab Rev. 2009;41(3):391-407. doi: 10.1080/10837450902891360. Drug Metab Rev. 2009. PMID: 19601719 Review.
-
Toxicokinetics as a key to the integrated toxicity risk assessment based primarily on non-animal approaches.Toxicol In Vitro. 2013 Aug;27(5):1570-7. doi: 10.1016/j.tiv.2012.06.012. Epub 2012 Jul 4. Toxicol In Vitro. 2013. PMID: 22771339 Review.
Cited by
-
Streamlining physiologically-based pharmacokinetic model design for intravenous delivery of nanoparticle drugs.CPT Pharmacometrics Syst Pharmacol. 2022 Apr;11(4):409-424. doi: 10.1002/psp4.12762. Epub 2022 Feb 7. CPT Pharmacometrics Syst Pharmacol. 2022. PMID: 35045205 Free PMC article.
-
A multi-model approach to predict efficacious clinical dose for an anti-TGF-β antibody (GC2008) in the treatment of osteogenesis imperfecta.CPT Pharmacometrics Syst Pharmacol. 2022 Nov;11(11):1485-1496. doi: 10.1002/psp4.12857. Epub 2022 Sep 27. CPT Pharmacometrics Syst Pharmacol. 2022. PMID: 36004727 Free PMC article.
-
Quantitative systems pharmacology of the eye: Tools and data for ocular QSP.CPT Pharmacometrics Syst Pharmacol. 2023 Mar;12(3):288-299. doi: 10.1002/psp4.12918. Epub 2023 Jan 27. CPT Pharmacometrics Syst Pharmacol. 2023. PMID: 36708082 Free PMC article. Review.
-
Application of machine learning in combination with mechanistic modeling to predict plasma exposure of small molecules.Front Syst Biol. 2023 Jun 20;3:1180948. doi: 10.3389/fsysb.2023.1180948. eCollection 2023. Front Syst Biol. 2023. PMID: 40809487 Free PMC article.
-
Predictive modeling of aspirin-triggered resolvin D1 pharmacokinetics for the study of Sjögren's syndrome.Clin Exp Dent Res. 2020 Apr;6(2):225-235. doi: 10.1002/cre2.260. Epub 2019 Dec 19. Clin Exp Dent Res. 2020. PMID: 32250566 Free PMC article.
References
-
- Russell WMS, Burch RL. The principles of humane experimental technique. The principles of humane experimental technique. 1959.
-
- Hartung T. Food for thought… on animal tests. ALTEX. 2008;25(1):3–16. . - PubMed
-
- Leist M, Hartung T, Nicotera P. The dawning of a new age of toxicology. ALTEX. 2008;25(2):103–14. . - PubMed
-
- Scholz S, Sela E, Blaha L, Braunbeck T, Galay-Burgos M, Garcia-Franco M, et al. A European perspective on alternatives to animal testing for environmental hazard identification and risk assessment. Regul Toxicol Pharmacol. 2013;67(3):506–30. doi: 10.1016/j.yrtph.2013.10.003 . - DOI - PubMed
-
- Lilienblum W, Dekant W, Foth H, Gebel T, Hengstler JG, Kahl R, et al. Alternative methods to safety studies in experimental animals: role in the risk assessment of chemicals under the new European Chemicals Legislation (REACH). Arch Toxicol. 2008;82(4):211–36. doi: 10.1007/s00204-008-0279-9 . - DOI - PubMed
Publication types
MeSH terms
Substances
LinkOut - more resources
Full Text Sources
Other Literature Sources
