. 2018 Mar 20;22(12):3191-3205.
doi: 10.1016/j.celrep.2018.02.095.

KIBRA (WWC1) Is a Metastasis Suppressor Gene Affected by Chromosome 5q Loss in Triple-Negative Breast Cancer

Affiliations

KIBRA (WWC1) Is a Metastasis Suppressor Gene Affected by Chromosome 5q Loss in Triple-Negative Breast Cancer

Jennifer F Knight et al. Cell Rep. .

Abstract

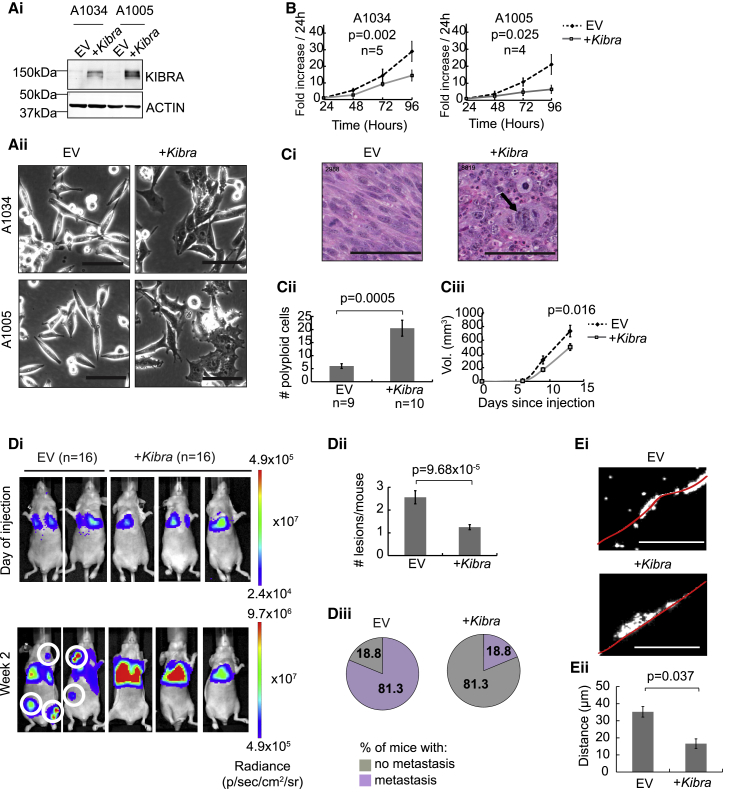
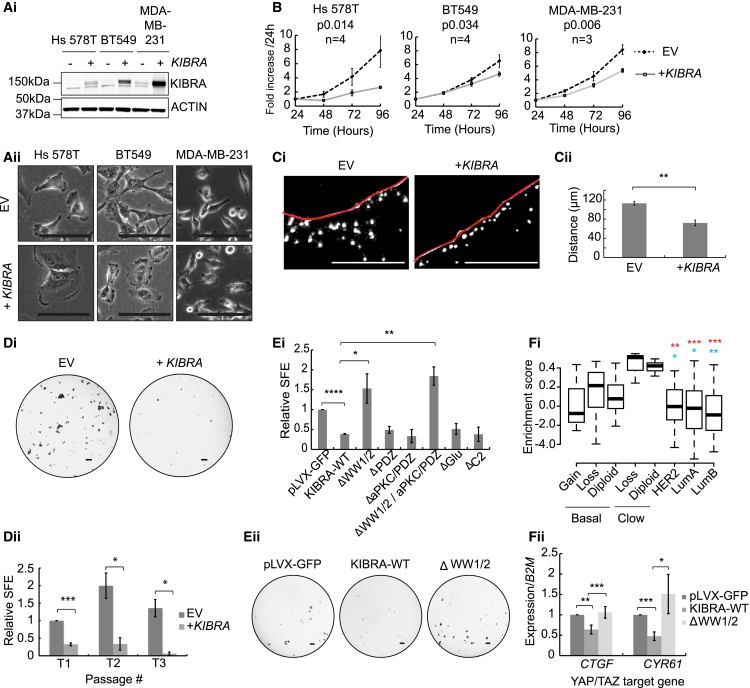
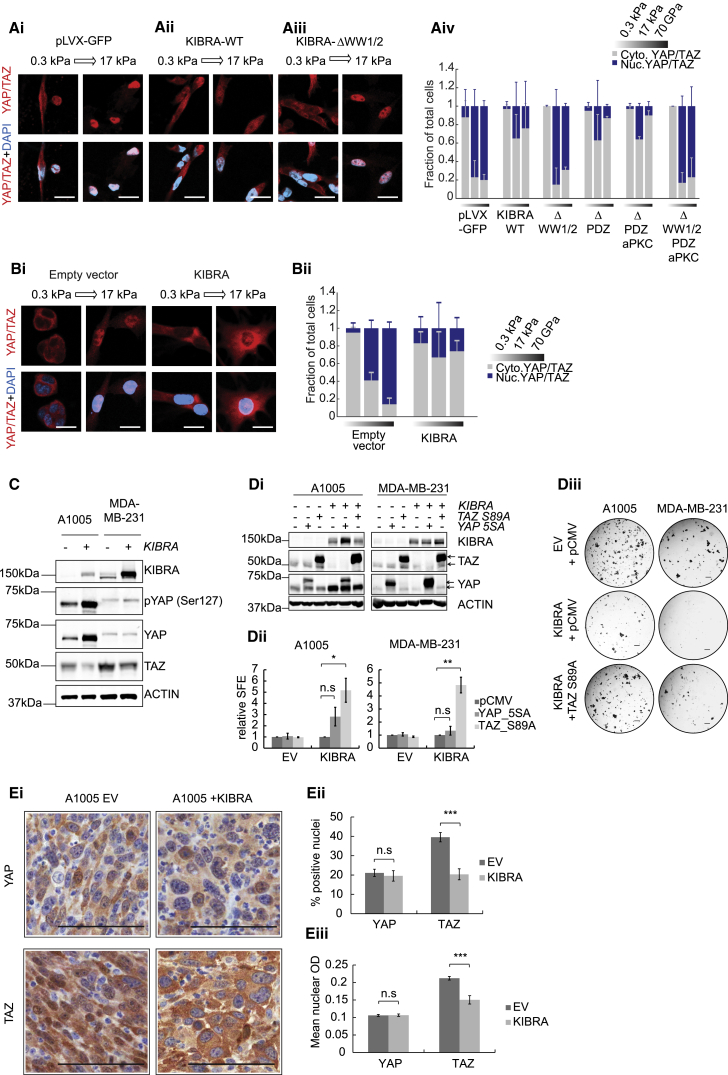
Triple-negative breast cancers (TNBCs) display a complex spectrum of mutations and chromosomal aberrations. Chromosome 5q (5q) loss is detected in up to 70% of TNBCs, but little is known regarding the genetic drivers associated with this event. Here, we show somatic deletion of a region syntenic with human 5q33.2-35.3 in a mouse model of TNBC. Mechanistically, we identify KIBRA as a major factor contributing to the effects of 5q loss on tumor growth and metastatic progression. Re-expression of KIBRA impairs metastasis in vivo and inhibits tumorsphere formation by TNBC cells in vitro. KIBRA functions co-operatively with the protein tyrosine phosphatase PTPN14 to trigger mechanotransduction-regulated signals that inhibit the nuclear localization of oncogenic transcriptional co-activators YAP/TAZ. Our results argue that the selective advantage produced by 5q loss involves reduced dosage of KIBRA, promoting oncogenic functioning of YAP/TAZ in TNBC.

Keywords: KIBRA; PTPN14; RHOA signaling; WWC1; YAP/TAZ; chr5q; mechanotransduction; metastasis; triple-negative breast cancer; tumorspheres.


Figures

None
Graphical abstract
Figure 1
Figure 1
Loss of Heterozygosity in Mouse Mammary Tumors Mimics Chromosome 5q Loss, a Frequent Event in Human TNBC (A) Example aCGH profiles of chromosome (chr) 11 in MMTV-Met (5156) and MMTV-Met;Trp53fl/+;Cre (A1005) mammary tumors. Black dots indicate individual microarray probes and red lines segmented means for regions deviating from a log copy number change of 0. The blue arrow indicates a minimal common region (MCR) of loss from 18.9–49.8 Mb. (B) Alignment of the MCR with human chr 5q. (C) Heatmap showing significant differential expression among mouse model tumors, with decreased expression of 13 genes in tumors with loss of the MCR. (D) Frequency of hemizygous deletion for 10 of 11 genes across PAM50 and claudin-low (CLow) breast cancer subtypes in TCGA data. (E) TCGA mRNA Z scores for all 10 genes among basal and claudin-low tumors with hemizygous loss. (F) TCGA mRNA Z scores for all molecular subtypes. Asterisks indicate statistical significance for differences in mRNA levels between basal/claudin-low tumors with copy number loss and other PAM50 subtypes. n = number of patients. See also Figures S1 and S2 and Tables S2 and S3.
Figure 2
Figure 2
Kibra Silencing Increases Tumor Cell Aggressivity in Mice (A) Knockdown of Kibra in the MMTV-Met mammary tumor cell line 5156-luciferase (5156-luc). Two independent shRNAs (SH3 and SH4) are compared with a pLKO-empty vector control. (Bi) 5156-luc cells were orthotopically injected and resected after 5 weeks. Representative bioluminescence images of metastatic dissemination are shown. Metastases (white circles) were confirmed in histological sections. n = number of mice. (Bii) Percentages of mice with confirmed lung and lymph node metastases. (Ci) H&E-stained lung sections from 3 representative mice per condition. Metastatic lesions are outlined in green. (Cii) Quantification of lung metastatic burden. (Ciii) Calculation of the lung area containing tumor (mean ± SEM). (Di) Representative images of invasion (white arrows) from cysts into the collagen matrix. Scale bars represent 50 μm. (Dii) Quantification of invasion (3 independent experiments, means ± SEM). (E) Migration velocity of cells on fibronectin-coated plates (3 independent experiments, 30 cells/condition/experiment, mean ± SEM). See also Figure S3.
Figure 3
Figure 3
Kibra Re-expression Has an Anti-tumorigenic Effect (Ai) Western blot showing stable KIBRA re-expression in MMTV-Met;Trp53fl/+;Cre mammary tumor cells (A1034 and A1005). (Aii) Altered cell morphology in Kibra-expressing cells. EV, empty vector control. Scale bars, 100 μm. (B) Proliferation of cell lines with or without Kibra. Shown is the mean of the indicated replicates ± SEM. (Ci) H&E-stained mammary tumor sections from mice orthotopically injected with A1005 cells with or without Kibra. The arrow indicates an example of polyploidy. Scale bars, 100 μm. (Cii) Quantification of karyomegalic/multi-nucleated (polyploid) cells per section (mean ± SEM). (Ciii) Growth of tumors from (Ci) (mean ± SEM), showing significant difference in endpoint tumor size. (Di) Representative bioluminescent images of mice immediately after and 2 weeks after intravenous injection of A1005-luciferase cells with or without Kibra. n = number of mice. White circles highlight metastases outside of the lungs. (Dii) Number of metastatic sites per mouse (mean ± SEM). (Diii) Percentage of mice with metastatic sites outside of the lungs (mean ± SEM). (Ei) Representative images of invasion of DAPI-stained (white) A1005 cells with or without Kibra. Scale bars, 250 μm. (Eii) Quantification of invasion as distance traveled through collagen from the seeded area (red line in Ei) (n = 3, mean ± SEM). See also Figure S4.
Figure 4
Figure 4
KIBRA Expression Reduces the Invasiveness and Tumorsphere-Forming Capacity of Breast Cancer Cells and Correlates with a YAP/TAZ Signature in Human Breast Cancers (Ai) Western blot showing stable KIBRA expression in 3 basal B breast cancer cell lines. (Aii) Images showing KIBRA-induced loss of mesenchymal features. Scale bars, 100 μm. (B) Proliferation with or without KIBRA. Shown are the mean values of the indicated replicates ± SEM. (Ci) Representative images of invasion of DAPI-stained (white) MDA-MB-231 cells with or without KIBRA. Scale bars, 250 μm. (Cii) Quantification of invasion as distance traveled through collagen from the seeded area (red line). n = 3, mean ± SEM. (Di) Representative images of MDA-MB-231 tumorspheres with or without KIBRA. Scale bars, 400 μm. (Dii) Sphere-forming efficiency (SFE) calculated at 3 serial passages (T1, T2, and T3) and normalized to EV control at T1 (n = 3, mean ± SEM). (Ei) SFE for MDA-MB-231 cells expressing a control (pLVX-GFP) compared with cells expressing either wild-type KIBRA (KIBRA-WT) or KIBRA mutants lacking specific regions as indicated (n = 3, mean ± SEM). (Eii) Representative images of tumorspheres in (Ei). Scale bars, 400 μm. (Fi) Gene set variation analysis (GSVA) showing enrichment of a YAP/TAZ gene expression signature. Basal and claudin-low subtypes are divided by KIBRA copy number gain or loss or diploid status. Asterisks indicate statistical differences between PAM50 subtypes and claudin-low (blue) or basal (red) tumors affected by KIBRA copy number loss. (Fii) qRT-PCR for YAP/TAZ targets in MDA-MB-231 cells expressing vector control, KIBRA-WT, or ΔWW1/2-KIBRA (n = 3, mean ± SEM). See also Figure S5.
Figure 5
Figure 5
Anti-tumorigenic Effects of KIBRA Are Associated with a Reduction in TAZ Protein Levels and Inhibition of TAZ Nuclear Localization (Ai–Aiii) Subcellular localization of YAP/TAZ in MDA-MB-231 cells expressing wild-type KIBRA (KIBRA-WT), ΔWW1/2-KIBRA, or control (pLVX-GFP) in response to increasing matrix tension (0.3 to 17 kPa). Scale bars, 20 μm. (Aiv) Quantification of nuclear to cytoplasmic YAP/TAZ ratios under conditions of soft (0.3 kPa) or stiff (17 kPa) matrix or a collagen-coated glass coverslip (70 GPa) (n = 3, mean ± SD). (Bi and Bii) Representative images and quantification of YAP/TAZ localization in A1005 cells in response to matrix tension as in (A). (C) Western blot showing YAP phosphorylation and TAZ protein levels in MDA-MB-231 and A1005 cells with or without KIBRA. (Di) Western blots confirming transfection of constitutively active YAP or TAZ in A1005 and MDA-MB-231 cells with KIBRA. The empty pCMV vector is a negative control. The arrows indicate tagged (top) and endogenous (bottom) proteins. (Dii) Quantification of SFE relative to empty vector for cells in (Di) (n = 3, ± SEM). (Diii) Representative tumorsphere images. Scale bars, 400 μm. (Ei) Immunohistochemistry (IHC) showing YAP and TAZ subcellular localization in A1005 orthotopic tumors with or without KIBRA. Scale bars, 100 μm. (Eii and Eiii) Percentage of cells with positive nuclear staining (ii) and mean optical density (OD) of nuclear staining (iii) for YAP and TAZ in ten fields of view, 6 to 10 sections per condition (mean ± SEM). See also Figure S5.
Figure 6
Figure 6
The KIBRA WW1/2 Domain Interactor PTPN14 Is Required for KIBRA-Mediated Inhibition of Tumorsphere Formation (Ai) High-confidence KIBRA-proximal proteins from BioID mass spectrometry analysis of MDA-MB-231 cells expressing WT or mutated KIBRA. (Aii) Co-immunoprecipitation of KIBRA and PTPN14 in MDA-MB-231 cells expressing wild-type or mutated KIBRA. (Bi) Western blot showing PTPN14 levels in MDA-MB-231-KIBRA cells expressing 3 PTPN14 shRNAs (SH2, SH3, and SH4) or empty vector (pLKO). (Bii) Representative images of MDA-MB-231 tumorspheres expressing pLKO or PTPN14 SH4 ± KIBRA. Scale bars, 400 μm. (Biii) SFE of MDA-MB-231 cells expressing pLKO or PTPN14 shRNA with or without KIBRA, normalized to the appropriate shRNA-alone condition (conditions seeded in triplicate, mean of 2 experiments ± SEM). (Ci) YAP/TAZ localization in MDA-MB-231 cells expressing pLKO or PTPN14 shRNA with or without KIBRA. Scale bars, 40 μm. (Cii) Quantification of YAP/TAZ nuclear to cytoplasmic ratios in MDA-MB-231 cells expressing pLKO or PTPN14 shRNA with or without KIBRA, cultured on soft (0.3 kPa) or stiff (17 kPa) matrix or collagen-coated glass coverslips (70 GPa) (n = 3 mean ± SD). (D) Pearson correlation analysis of WWC1 (KIBRA) and PTPN14 mRNA levels (Z scores) in pooled basal and claudin-low patients (TCGA data, n = 89). See also Figure S6 and Table S4.
Figure 7
Figure 7
KIBRA and PTPN14 Co-operatively Regulate Actin Cytoskeletal Tension to Inhibit the Nuclear Translocation of YAP/TAZ (Ai) Representative phalloidin staining and YAP/TAZ immunofluorescence of MDA-MB-231 cells expressing empty vector, wild-type KIBRA, or ΔWW1/2 KIBRA seeded on collagen-coated coverslips. White arrows indicate actin stress fibers. Scale bars, 10 μm. (Aii) Representative immunofluorescence as in (Ai) for cells expressing pLKO control or shPTPN14 (SH4) with or without KIBRA. (Bi and Bii) Number of stress fibers per cell for (Ai) and (Aii) (n = 3, mean ± SEM). (Ci) Representative Rhotekin-GST pull-down in MDA-MB-231 cells expressing EV or KIBRA. GST alone was used as a control (Ctrl). (Cii) RHOA activity determined by G-LISAs (n = 3, mean ± SEM). (Ciii) RHOA protein levels for (Cii). (D) Schematic diagram showing regulation of TAZ by KIBRA. (Di) In the absence of KIBRA, stiff ECM activates RHOA, leading to actin stress fiber formation and contractility, facilitating TAZ nuclear translocation and interaction with TEA-domain (TEAD) transcription factors to promote expression of pro-oncogenic genes. (Dii) Association of KIBRA with PTPN14 inhibits RHOA activation required for actin stress fiber assembly, removing the stimulus for nuclear translocation of TAZ and resulting in its proteasomal degradation. See also Figure S7.

References

    1. Al-Mulla F., AlFadhli S., Al-Hakim A.H., Going J.J., Bitar M.S. Metastatic recurrence of early-stage colorectal cancer is linked to loss of heterozygosity on chromosomes 4 and 14q. J. Clin. Pathol. 2006;59:624–630. - PMC - PubMed
    1. Aragona M., Panciera T., Manfrin A., Giulitti S., Michielin F., Elvassore N., Dupont S., Piccolo S. A mechanical checkpoint controls multicellular growth through YAP/TAZ regulation by actin-processing factors. Cell. 2013;154:1047–1059. - PubMed
    1. Bartucci M., Dattilo R., Moriconi C., Pagliuca A., Mottolese M., Federici G., Benedetto A.D., Todaro M., Stassi G., Sperati F. TAZ is required for metastatic activity and chemoresistance of breast cancer stem cells. Oncogene. 2015;34:681–690. - PubMed
    1. Basu-Roy U., Bayin N.S., Rattanakorn K., Han E., Placantonakis D.G., Mansukhani A., Basilico C. Sox2 antagonizes the Hippo pathway to maintain stemness in cancer cells. Nat. Commun. 2015;6:6411. - PMC - PubMed
    1. Baumgartner R., Poernbacher I., Buser N., Hafen E., Stocker H. The WW domain protein Kibra acts upstream of Hippo in Drosophila. Dev. Cell. 2010;18:309–316. - PubMed

Publication types

MeSH terms

Substances

Supplementary concepts

LinkOut - more resources