. 2018 Mar 21;10(3):402-424.
doi: 10.18632/aging.101402.

Preferential Ty1 retromobility in mother cells and nonquiescent stationary phase cells is associated with increased concentrations of total Gag or processed Gag and is inhibited by exposure to a high concentration of calcium

Affiliations

Preferential Ty1 retromobility in mother cells and nonquiescent stationary phase cells is associated with increased concentrations of total Gag or processed Gag and is inhibited by exposure to a high concentration of calcium

Andrew C Peifer et al. Aging (Albany NY). .

Abstract

Retrotransposons are abundant mobile DNA elements in eukaryotic genomes that are more active with age in diverse species. Details of the regulation and consequences of retrotransposon activity during aging remain to be determined. Ty1 retromobility in Saccharomyces cerevisiae is more frequent in mother cells compared to daughter cells, and we found that Ty1 was more mobile in nonquiescent compared to quiescent subpopulations of stationary phase cells. This retromobility asymmetry was absent in mutant strains lacking BRP1 that have reduced expression of the essential Pma1p plasma membrane proton pump, lacking the mRNA decay gene LSM1, and in cells exposed to a high concentration of calcium. Mother cells had higher levels of Ty1 Gag protein than daughters. The proportion of protease-processed Gag decreased as cells transitioned to stationary phase, processed Gag was the dominant form in nonquiescent cells, but was virtually absent from quiescent cells. Treatment with calcium reduced total Gag levels and the proportion of processed Gag, particularly in mother cells. We also found that Ty1 reduced the fitness of proliferating but not stationary phase cells. These findings may be relevant to understanding regulation and consequences of retrotransposons during aging in other organisms, due to conserved impacts and regulation of retrotransposons.

Keywords: Saccharomyces cerevisiae; Ty1; quiescence; replicative aging; retrotransposon.


Conflict of interest statement

CONFLICTS OF INTEREST: The authors declare that they have no conflicts of interest.

Figures

Figure 1
Figure 1
Ty1his3AI assay for measuring Ty1 retromobility. A strain with a deletion at the endogenous HIS3 locus harbors a chromosomal Ty1 element with the his3AI indicator gene between Ty1 coding sequences and the 3′ long terminal repeat (white arrowheads indicate long terminal repeats). The strain cannot grow in the absence of histidine because the HIS3 sequence within Ty1 is disrupted by an oppositely oriented intron (AI, labeled “Intron” in drawing) that is not spliced when transcription initiates from the HIS3 promoter. Transcription of Ty1his3AI from the Ty1 promoter allows splicing of AI, and reverse transcription produces a Ty1HIS3 cDNA that can be incorporated into the genome. Cells that acquire Ty1HIS3 through a retromobility event express HIS3 and gain a His+ prototroph phenotype.
Figure 2
Figure 2
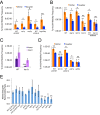
Mother-daughter asymmetry in Ty1 retromobility depends on pH homeostasis and mRNA decay factors. (A-B) His+ frequencies for mother and daughter cells of the indicated genotypes separated by magnetic cell sorting after growth in standard YPD medium or in YPD buffered to pH 7.1 with 20 mM sodium phosphate (buffered). Mutants are shown to the right of their corresponding wild type strain (JC3787 or JC3212 in panel A, JC3787 in panel B). Results from three to six trials per genotype are shown. (C) His+ frequencies for cells of the indicated genotypes grown to mid-exponential phase with a low copy vector or a low copy vector with a copy of PMA1 under the control of its native promoter. (D) Same as for panels A and B. JC3787 and JC3212 wild type data are the same as for panels B and A, respectively. (E) Ratios of Ty1 retromobility frequencies in mothers divided by the frequencies in daughters for all the strains and conditions from panels A, B, and D. All graphs show mean values and standard deviations. Single, double, or triple asterisks indicate p<0.05, 0.01, or 0.001, respectively, and “ns” indicates p>0.05. Asterisks over individual columns indicate differences compared to the relevant control or wild type value. Horizontal bars indicate comparisons between mother and daughter cells for a given genotype or condition. Note that the y-axis in panels B and D is a log scale to show significant variation in frequencies.
Figure 3
Figure 3
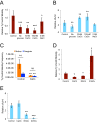
Growth in medium with a high calcium concentration abolishes mother-daughter retromobility asymmetry. (A) Relative His+ frequencies after eight-hour incubations in conditions known to induce P-bodies normalized to the frequencies immediately prior to the eight-hour incubations. Results are for 11 control trials and three to seven trials in the other conditions. (B) Colony forming units (cfu) per mL after the eight-hour incubations normalized to the cfu/mL immediately prior to the incubations for the trials shown in panel A. (C) His+ frequencies for sorted mother and daughter cells without (six trials) or with (four trials) chronic exposure to 100 mM calcium chloride. Control data are the same as from Fig. 2B. (D) Relative His+ frequencies after eight-hour incubations in 10 mM calcium chloride, manganese chloride, or zinc sulfate for three trials. (E) Cfu/mL after the eight-hour incubations normalized to the cfu/mL immediately prior to the incubations for the experiments from panel D. All graphs show mean values and standard deviations. Double or triple asterisks indicate p<0.05, 0.01, or 0.001, respectively, and “ns” indicates p>0.05. Asterisks over individual columns indicate differences compared to the control or wild type value. Horizontal bars indicate comparisons between mother and daughter cells.
Figure 4
Figure 4
Fractionated Q and NQ cells show expected phenotypes. The relative level of WGA Alexa-488 staining of bud scars relative to unstained cells (A), percentage of cells with buds less than or equal to 50% the size of mothers (B), that could form colonies on YPD medium after heat shock at 52˚C for 20 minutes (C), or that could form colonies on YPD medium without treatment (D) for Q and NQ cells fractionated from populations grown for seven to eight days at 20˚C. (E) Proportion of fractionated Q cells in SC or YPD medium determined by counting cells by microscopy. Mean and standard deviations for seven or ten trials are shown and double asterisks indicate p<0.01 compared to NQ cells.
Figure 5
Figure 5
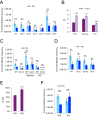
Ty1 retromobility asymmetry between quiescent and nonquiescent stationary phase cells also depends on LSM1, calcium, and pH homeostasis. (A) His+ frequencies in stationary phase cells grown in YPD and fractionated into quiescent (Q) and nonquiescent (NQ) subpopulations for the indicated genotypes or with chronic exposure to 100 mM calcium chloride. Results from three to six trials are shown. (B) Final (stationary phase) medium pH for Q and NQ cells from wild type or brp1∆ mutants for cells grown in control YPD medium, or YPD medium with an initial pH of 7.1 or 4.1 due to addition of 20 mM sodium phosphate (Na-phos) or 30 mM hydrochloric acid (HCl), respectively. Data are from three to five trials each. (C) His+ frequencies in Q and NQ cells for the strains and control or alternative media conditions from panel B. Control wild type data are the same as in panel A. (D) His+ frequencies in Q and NQ cells fractionated from the indicated strains after growth in SC medium. Results are for three to five trials. (E) The proportion of Q cells after fractionation of cells grown to stationary phase in YPD or YP + 2% ethanol (YPE) for three trials. (F) His+ frequencies in Q and NQ cells isolated after growth in YPD or YPE for three trials. All graphs show mean values with standard deviation, and symbols for statistical significance are as for Fig. 2.
Figure 6
Figure 6
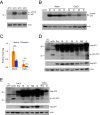
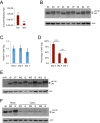
Calcium treatment reduces Gag levels and masks or suppresses the effects of brp1∆ or lsm1∆ mutations. (A) Western blot of protein extracts from cells grown to exponential phase in YPD with or without 100 mM calcium chloride probed with an affinity-purified polyclonal Gag antibody (upper panel). Arrows indicate the migration of the different forms of Gag, and the number on the left indicates the migration of a protein size standard in kilodaltons (kD). Note that the blot was moderately overexposed to better show the weak signal for calcium-treated cells. The lower panel shows the same blot stripped and reprobed with a beta-actin antibody as a loading control. The extract from an spt3∆ mutant was used as a control for low expression. (B) His+ frequencies for mid-exponential phase cells of the indicated genotypes grown in YPD medium without (Mock) or with 100 mM calcium chloride (Ca). Data are for three trials. Horizontal bars indicate comparisons between treated and untreated cells. (C) Same as for panel B for three trials with a different set of mutant strains. Note that a log scale is used for the y-axis because of the large differences in frequencies. (D) Western blot for Gag in wild type (WT) and pmr1∆ mutant strains, as described for panel A. All data in graphs are mean values with standard deviation. Asterisks over individual columns indicate comparisons to wild type treated or untreated cells. Asterisks indicate significant differences as for Fig. 2.
Figure 7
Figure 7
Mother cells have increased levels of Gag. (A) Western blot of protein extracts from cells grown in YPD to late exponential phase at the indicated temperatures. Upper panel shows the blot probed with Gag antibody and the lower panel shows the blot stripped and reprobed with beta-actin antibody. Arrows indicate the migration of the alternative forms of Gag, and the number to the left shows the migration of a 50 kD protein size standard. (B) Western blot for Gag protein present in extracts of sorted mother (M) and daughter (D) cells grown in YPD without or with 100 mM calcium chloride, as described for panel A. An extract from an spt3∆ strain was used as a control for low Gag expression. (C) Quantification of the Gag signal normalized to beta-actin from Western blots of mother and daughter cell extracts grown with or without 100 mM calcium chloride. Data are mean and standard deviation values for three trials. Horizontal bars indicate comparisons between mothers and daughters. Asterisks over individual columns indicate comparisons to mock treatment. Symbols for statistical significance are as for Fig. 2. (D-E) Westerns blots of extracts prepared from mother (M), daughter (D), nonquiescent (NQ), quiescent (Q), and exponential phase (Exp) cells expressing a Gag-GFP fusion protein, or a control strain lacking the fusion protein (no GFP). Upper two blot panels in each case were probed with a GFP antibody, with the top image being overexposed to show p22-GFP (arrow). Middle image shows a shorter exposure for Gag-GFP, and bottom image shows the blot stripped and reprobed with beta-actin antibody. Some extracts were prepared from cells grown in 100 mM calcium chloride for panel E, as indicated. Migration of 85 and 50 kD size standards is indicated to the left for the top image.
Figure 8
Figure 8
Ty1 retromobility and the proportion of mature p45-Gag decrease as cells transition to stationary phase. (A) His+ rates per cell generation for cells grown to mid-exponential (Exp, two days) or early stationary phase (Stat, four days). Data are for five trials. (B) Western blot probed with Gag antibody (upper panel) or reprobed with beta-actin antibody as a loading control (lower panel) for protein extracts prepared from cells grown for two days to exponential phase (d2), four days to early stationary phase (d4), or seven days to stationary phase (d7). Arrows indicate the migration of the different forms of Gag. (C) Quantification of Gag levels normalized to beta-actin in cells grown for the indicated number of days. Data are for three trials. (D) Quantification of the proportion of the total Gag signal that was comprised of p45 for cells grown for the indicated number of days for three trials. Data are from three trials. Horizontal bars indicate comparisons between days two and four or days four and seven. (E-F) Western blots for Gag and beta-actin as described for panel B for cell extracts prepared from exponential phase cells (d2, spt3∆), stationary phase cells (d7), or fractionated NQ and Q cells grown in YPD without (panel E and panel F Mock) or with (CaCl2) 100 mM calcium chloride. Graphs show mean values with standard deviation. Asterisks indicate significant differences as for Fig. 2.
Figure 9
Figure 9
Ty1 reduces the reproductive potential of dividing cells. (A) Proportion of His+ cells in NQ or Q cell populations regrown in fresh medium at 30˚C overnight expressed as a percentage of the proportion of His+ cells in the populations prior to regrowth. (B) Relative decrease in the frequency of His+ cells per cell doubling in the populations regrown overnight for the data in panel A. (C) Plating efficiencies for mid-exponential (Exp, two days) and early stationary phase (Stat, four days) populations of S. paradoxus strains with zero, one to three (low), or about 20 (high) chromosomal copies of Ty1 grown at 20˚C and normalized to the values for the zero copy strain. Data are from five to nine trials. Three low copy and three high copy strains were used. (D) Percentages of cells with buds in strains with the indicated Ty1 copy number grown at 20˚C for seven days, determined by light microscopy. Buds less than or more than 50% the size of the mother cells were scored as small or large, respectively. Three low copy and three high copy strains were used and results are from five to six trials. All data are mean values with standard deviation. Single or triple asterisks indicate p<0.05 or 0.001, respectively.
Figure 10
Figure 10
A Ty1-less S. paradoxus strain background does not yield a Q cell fraction and has a short chronological lifespan. (A) Proportion of Q cells from stationary phase cultures following density gradient fractionation of the S. cerevisiae (cer) and S. paradoxus (par) zero and high Ty1 copy strains. Data are from three trials. (B) Chronological lifespan at 20˚C determined by measuring cell viability through trypan blue dye exclusion for three trials with a wild type S. cerevisiae strain (S. cer) and the zero and high Ty1 copy S. paradoxus strains. (C) Growth rates (cell doublings per hour) for three trials of a wild type S. cerevisiae strain (cer) and four trials of the zero and high Ty1 copy S. paradoxus strains (par) grown in rich medium with glucose (YPD) or glycerol (YP + Gly) as a carbon source. All data are mean values with standard deviation. Triple asterisks indicate p<0.001.

Similar articles

Cited by

References

    1. Gorbunova V, Boeke JD, Helfand SL, Sedivy JM. Sleeping dogs of the genome: retrotransposable elements may be agents of somatic diversity, disease and aging. Science. 2014; 346:1187–88. 10.1126/science.aaa3177 - DOI - PMC - PubMed
    1. Maxwell PH. What might retrotransposons teach us about aging? Curr Genet. 2016; 62:277–82. 10.1007/s00294-015-0538-2 - DOI - PMC - PubMed
    1. Maxwell PH, Burhans WC, Curcio MJ. Retrotransposition is associated with genome instability during chronological aging. Proc Natl Acad Sci USA. 2011; 108:20376–81. 10.1073/pnas.1100271108 - DOI - PMC - PubMed
    1. Hu Z, Chen K, Xia Z, Chavez M, Pal S, Seol JH, Chen CC, Li W, Tyler JK. Nucleosome loss leads to global transcriptional up-regulation and genomic instability during yeast aging. Genes Dev. 2014; 28:396–408. 10.1101/gad.233221.113 - DOI - PMC - PubMed
    1. Patterson MN, Scannapieco AE, Au PH, Dorsey S, Royer CA, Maxwell PH. Preferential retrotransposition in aging yeast mother cells is correlated with increased genome instability. DNA Repair (Amst). 2015; 34:18–27. 10.1016/j.dnarep.2015.07.004 - DOI - PMC - PubMed

Publication types

MeSH terms

LinkOut - more resources