. 2018 Mar 29;555(7698):647-651.
doi: 10.1038/nature26136. Epub 2018 Mar 21.

Insulin resistance in cavefish as an adaptation to a nutrient-limited environment

Affiliations

Insulin resistance in cavefish as an adaptation to a nutrient-limited environment

Misty R Riddle et al. Nature. .

Erratum in

Abstract

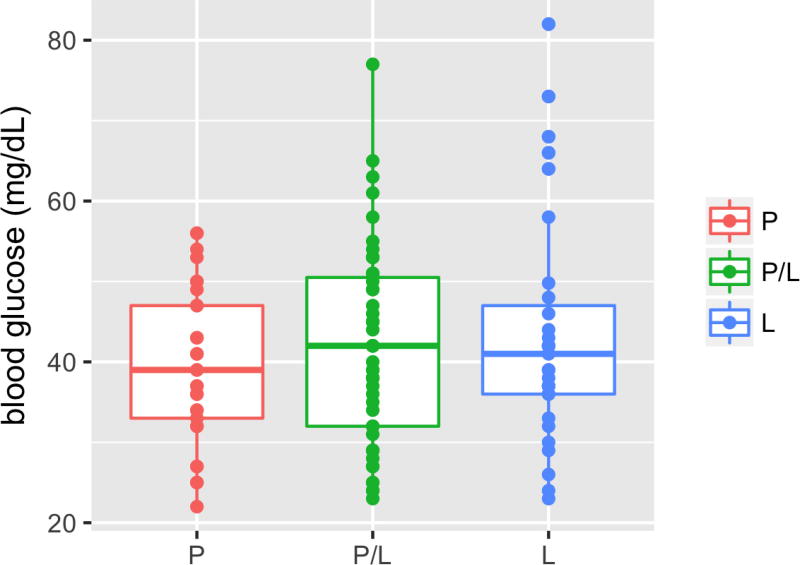
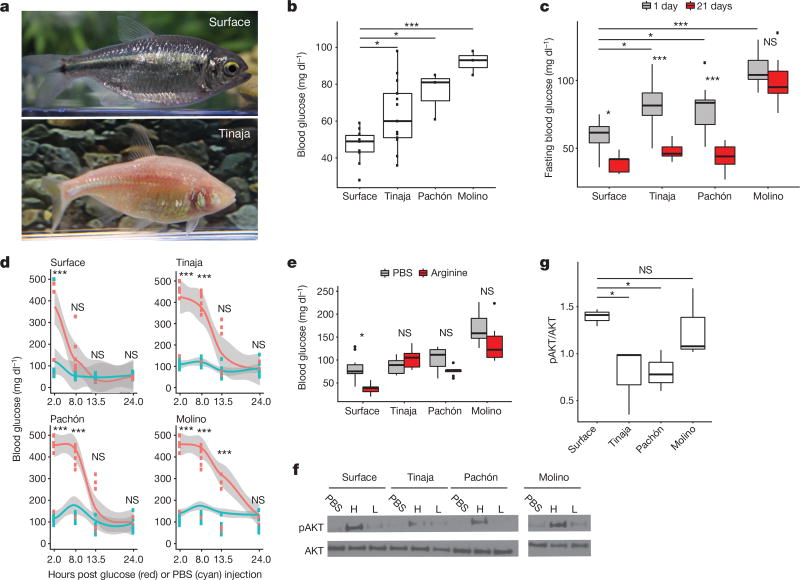
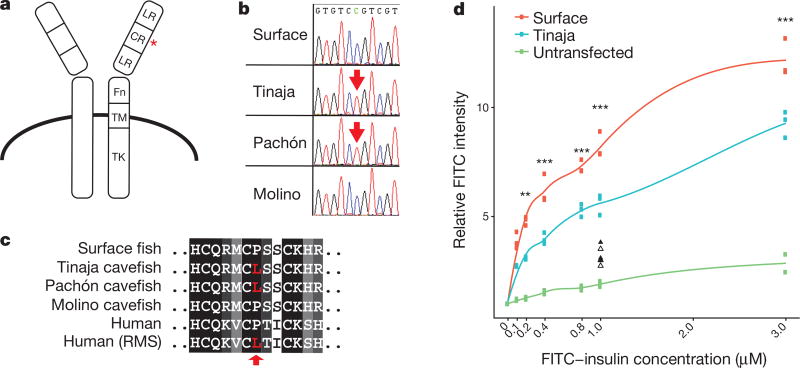
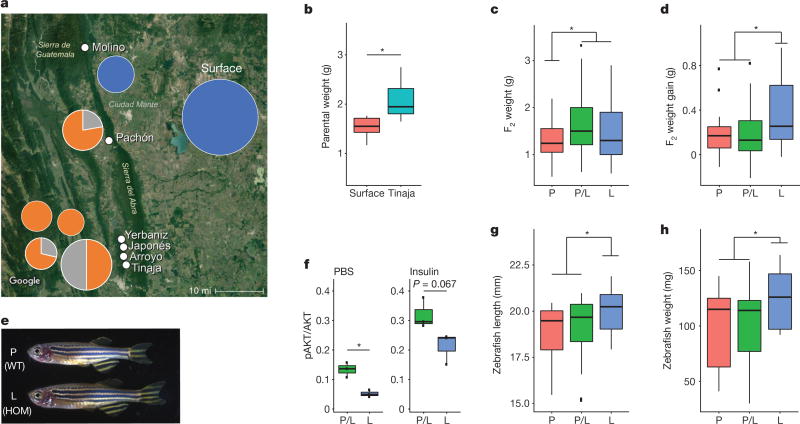
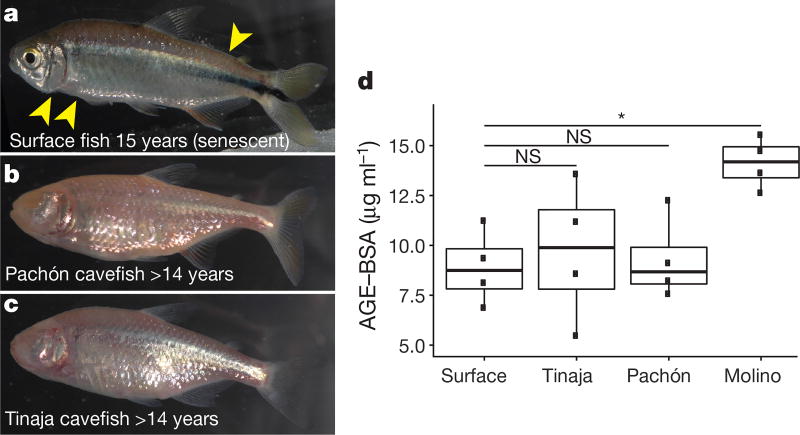
Periodic food shortages are a major challenge faced by organisms in natural habitats. Cave-dwelling animals must withstand long periods of nutrient deprivation, as-in the absence of photosynthesis-caves depend on external energy sources such as seasonal floods. Here we show that cave-adapted populations of the Mexican tetra, Astyanax mexicanus, have dysregulated blood glucose homeostasis and are insulin-resistant compared to river-adapted populations. We found that multiple cave populations carry a mutation in the insulin receptor that leads to decreased insulin binding in vitro and contributes to hyperglycaemia. Hybrid fish from surface-cave crosses carrying this mutation weigh more than non-carriers, and zebrafish genetically engineered to carry the mutation have increased body weight and insulin resistance. Higher body weight may be advantageous in caves as a strategy to cope with an infrequent food supply. In humans, the identical mutation in the insulin receptor leads to a severe form of insulin resistance and reduced lifespan. However, cavefish have a similar lifespan to surface fish and do not accumulate the advanced glycation end-products in the blood that are typically associated with the progression of diabetes-associated pathologies. Our findings suggest that diminished insulin signalling is beneficial in a nutrient-limited environment and that cavefish may have acquired compensatory mechanisms that enable them to circumvent the typical negative effects associated with failure to regulate blood glucose levels.


Conflict of interest statement

The authors declare no competing interests.

Figures

Extended Data Figure 1
Extended Data Figure 1. Numbers of insulin- and glucagon-positive cells in the developing pancreas are unchanged in Tinaja cavefish relative to surface fish
a, Whole-mount immunohistochemical detection of insulin- and glucagon-positive cells in Tinaja larvae at 10 days post fertilization. b, Number of glucagon- and insulin-positive cells in surface and Tinaja larvae at 10–11 days post fertilization (n = 5 fish per population,). c, Average number of glucagon- and insulin-positive cells, fish length, ratio of insulin to glucagon positive cells and P value comparing the surface and Tinaja values (determined using Student’s t-test)
Extended Data Figure 2
Extended Data Figure 2. Serum glucagon levels are comparable between the different populations
Box plot comparing serum glucagon levels between surface, Tinaja, Molino and Pachón fish after 24-h fast. n = 12 fish per population, average of 57.87, 59.76, 79.66 and 48.89 respectively. P = 0.52, one-way ANOVA. Box plots show 25th, 50th and 75th percentiles (horizontal bars), and 1.5× interquartile ranges (error bars), dots represent outliers
Extended Data Figure 3
Extended Data Figure 3. Serum insulin levels are comparable between surface and Tinaja fish
a, Serum blotted onto nitrocellulose membrane using Bio-Dot SF microfiltration apparatus (Bio-Rad, catalogue number 1706542) probed with anti-insulin antibody (DAKO). Each blot represents an individual fish between 1- and 2-years-old (n = 24 fish per population). b, Quantification of insulin level measured by densitometry of blots. AU, artificial units; median, 25th, 50th and 75th percentiles (horizontal bars) and error bars at 1.5× interquartile ranges. Tinaja cavefish insulin levels (mean = 10,770) tended to be higher than those of surface fish (mean = 7,194) but the results are not significant (P = 0.057, Student’s two-sample t-test)
Extended Data Figure 4
Extended Data Figure 4. Insulin decreases blood glucose level in surface fish
a, We injected different concentrations of human recombinant insulin (Sigma, product I9278, stock 9.5–11.5 mg ml−1) into the intraperitoneal cavity of surface fish to determine the effective dosage for subsequent experiments. Blood glucose levels are significantly lower after injection of approximately 0.6 or 0.06 g insulin per mg of fish weight compared to 0.0006 g (30 min after injection, n = 4 fish per dosage, dots represent individual fish, significance calculated using one-way ANOVA with Tukey’s HSD post hoc test, * P < 0.05). We used 0.06 g insulin per mg of fish in subsequent experiments. b, Blood glucose levels of surface fish over time, after injection of PBS or insulin. Blood glucose levels are significantly lower at 60 and 90 min compared to 15 min after insulin injection (n = 10 fish per time point and condition, significance calculated using one-way ANOVA with Tukey’s HSD post hoc test, * P < 0.05). Therefore, we focused on the 60-min time point for comparisons with Tinaja cavefish. c, Blood glucose levels at 15 and 60 min after insulin injection in surface fish and Tinaja cavefish. Surface fish display a significant decrease in blood glucose levels, whereas cavefish display a significant increase in blood glucose levels (significance calculated using two-tailed Student’s t-test, * P < 0.05, * * * P < 0.0005). Tinaja cavefish blood glucose levels may increase owing to the stress of being injected; stress hormones, such as catecholamines, ACTH and epinephrine, cause transient increases in blood glucose in humans and mice, an effect that cannot be mitigated in the absence of insulin signalling. Although both cavefish and surface fish probably undergo a stress response upon injection, this is overcome in the surface fish, which have wild-type insulin activity, but not in the Tinaja cavefish, which have reduced insulin signalling
Extended Data Figure 5
Extended Data Figure 5. An elevated fasting blood glucose level correlates with the presence of the P211L allele in F2 hybrids
Blood glucose levels of 192 F2 surface–Tinaja hybrids of the indicated genotype 24 h after feeding. All of the fish with elevated blood glucose (greater than 60 mg dl−1) carry the P211L allele. Median, 25th, 50th and 75th percentiles (horizontal bars), and error bars at 1.5× interquartile ranges
Extended Data Figure 6
Extended Data Figure 6. Egg mass is a confounding variable in female fish
a, Image of an F2 surface–Tinaja hybrid female and removed gonad, of indicated weights. b, Histogram displaying per cent gonad weight (gonad weight/total weight, multiplied by 100) of 62 F2 surface–Tinaja hybrid females fed 6 mg per day for 4 months (minimum = 3.57, 1st quartile = 10.64, median = 13.96, mean = 13.96, 3rd quartile = 17.57 and maximum = 41.86)
Extended Data Figure 7
Extended Data Figure 7. Genome editing strategy
CRISPR–Cas9 mediated genome editing strategy in exon 3 of the insulin receptor a (insra) zebrafish gene. The guide RNA target sequence is emphasized in bold in both the reverse strand of the wild-type genomic DNA and in the ssODN. The intended SNP exchanges are underlined, and the specific C632T to alter the P211 to L is denoted with a star. Both ends of the ssODN are protected by three phosphorothioate bonds, denoted with asterisks. The protospacer adjacent motif is shown in orange
Extended Data Figure 8
Extended Data Figure 8. Scale growth is impaired in the insra zebrafish mutant
a, Quantification of scale size in zebrafish of the indicated genotype; each point represents the mean scale size of an individual fish based on the measurement of 10–14 scales removed from the left side of the body from the posterior edge of the dorsal fin to the posterior edge of the ventral fin by gentle scraping with a scalpel. Wild type (P), n = 4, P211L mutant (L), n = 3. b, c, Representative images of scales stained with 0.005% calcein with contrast and brightness adjusted to show scale edges. Significance calculated using two-way t-test of mean values, * P < 0.05.
Figure 1
Figure 1. Altered glucose homeostasis in cave-adapted A. mexicanus populations
a, Surface fish and Tinaja cavefish of A. mexicanus. b, Blood glucose (1 h postprandial) in surface fish compared to cavefish (n = 10, 13, 3 and 3, respectively, for surface fish, Tinaja, Pachón and Molino cavefish). c, Fasting blood glucose at day 1 versus day 21 (n = 20 per population and condition). d, Glucose tolerance test. Blood glucose after intraperitoneal injection of glucose (red) or PBS (blue). Data points represent values for individual fish and grey shade indicates 95% confidence interval for polynomial regression. e, Blood glucose 5 h after intraperitoneal injection of arginine (n = 10 per population and condition). f, Western blot: cell lysates probed with pAKT (ser473) and AKT antibodies. Lysates produced from skeletal muscle treated ex vivo with PBS, a high (H, 9.5–11.5 µg ml−1) or a low (L, 0.95–1.15 µg ml−1) level of insulin. g, Quantification of bands by densitometry of highest concentration treatment (n = 3 per population). For box plots, median, 25th, 50th and 75th percentiles are represented by horizontal bars, and vertical bars represent 1.5× interquartile ranges. Significance calculated using one-way ANOVA with Tukey’s honest significant difference (HSD) post hoc test. NS, P > 0.05; * P < 0.05; * * P < 0.005; * * * P < 0.0005. For gel source data, see Supplementary Fig. 1.
Figure 2
Figure 2. Coding mutation in the cavefish insulin receptor leads to decreased insulin binding
a, Schematic of the insulin receptor (adapted from ref. 24). Red asterisk depicts position of the P211L mutation. LR, leucine-rich repeats; CR, cysteine-rich domain; Fn, fibronectin type III domain; TM, transmembrane domain; TK, tyrosine-kinase domain. b, Sequence chromatogram of the mutation in Astyanax. c, Amino acid alignment of the insulin receptor P211L mutation with patients with Rabson–Mendelhall syndrome (‘Human (RMS)’). d, Relative FITC intensity of cells stably transfected with Flag-tagged surface-fish or Tinaja-cavefish insulin receptor and incubated with FITC-labelled insulin. Each point represents mean FITC intensity of >2,500 live cells normalized to the mean intensity of untreated cells. Lines represent results from local polynomial regression fitting. Triangles (surface fish, filled; Tinaja cavefish, unfilled) represent data from competitive binding assay in which cells were incubated with 10 µM unlabelled insulin. Significance calculated using one-way ANOVA (between surface fish and Tinaja cavefish) with Tukey’s HSD post hoc test, * P < 0.05; * * P < 0.005; * * * P < 0.0005.
Figure 3
Figure 3. The P211L mutation of insra is overrepresented in cave environments and is associated with higher body weight in surface–cave hybrids
a, Map of the region, overlain with genotyping results of wild-caught samples. Pie charts indicate percentage of fish homozygous for surface allele (blue), cave allele (orange) or heterozygous (grey). Size of pie chart roughly indicates the number of fish genotyped (Molino, n = 8; Surface, n = 71; Pachón, n = 9; Yerbaniz, n = 8; Japonés, n = 5; Arroyo, n = 7; Tinaja, n = 14; position of pie charts corresponds to location and vertical order of population name on the map). The P211L allele is absent in all wild-caught surface fish and Molino cavefish (descended from a more-recent surface-fish lineage). The P211L mutation is present in all sampled cavefish populations descended from the more-ancient surface-fish lineage. Tinaja, Yerbaniz, Japonés and Arroyo are geographically close and believed to represent a single invasion event; Pachón represents an independent invasion. Map source: Imagery ©2017 Landsat/Copernicus, Map data ©2017 Google, INEGI. b, Weight of Tinaja males (n = 6) and surface males (n = 5) on a nutrient-limited diet. c, Weight of 18-month-old F2 male Tinaja–surface hybrids genotyped for the P211L mutation. P-homozygous (P) surface fish, n = 22; L-homozygous (L) cavefish, n = 27; heterozygotes (P/L), n = 53. d, Change in weight of F2 Tinaja–surface hybrid males on fixed diet. n = 21 (P), 39 (P/L) and 20 (L). e, Images of wild-type (WT) and homozygous P211L mutant (HOM) zebrafish siblings. f, Ratio of pAKT:AKT in adult zebrafish skeletal muscle treated ex vivo with PBS or insulin (n = 3 per genotype and condition). g, h, Length and weight of wild-type zebrafish (n = 13 (P)) and heterozygous (n = 22 (P/L)) and homozygous (n = 11 (L)) P211L mutant zebrafish. In box plots the median, 25th, 50th, and 75th percentiles are represented by horizontal bars and vertical bars represent 1.5× interquartile ranges. Significance calculated using two-tailed students t-test, * P < 0.05.
Figure 4
Figure 4. Despite elevated blood glucose levels and insulin resistance, Tinaja and Pachón cavefish do not show signs of senescence and do not accumulate advanced glycation end-products in the blood
ac, Surface (a), Pachón (b) and Tinaja (c) fish kept in the laboratory for the indicated duration and fed ad libitum. Cavefish were wild-caught; ages represent minimum age. Surface fish (a) shows signs of ageing, such as loose skin and bent tails (yellow arrows), that are absent in cavefish at comparable ages (b, c). d, Quantification of advanced glycation end-products in serum (AGE–BSA) from approximately two-year-old fish after a three-day fast (n = 4 for each population). * P < 0.05, one-way ANOVA with Tukey’s HSD post hoc test. For box plots, median, 25th, 50th and 75th percentiles are represented by horizontal bars and vertical bars represent 1.5× interquartile ranges

Comment in

Similar articles

Cited by

References

    1. Culver DC, Pipan T. The Biology of Caves and Other Subterranean Habitats. Oxford Univ. Press; 2009.
    1. Horst Wilkens US. Evolution in the Dark, Darwin’s Loss Without Selection. Springer; 2017.
    1. Aspiras AC, Rohner N, Martineau B, Borowsky RL, Tabin CJ. Melanocortin 4 receptor mutations contribute to the adaptation of cavefish to nutrient-poor conditions. Proc. Natl Acad. Sci. USA. 2015;112:9668–9673. - PMC - PubMed
    1. Moran D, Softley R, Warrant EJ. Eyeless Mexican cavefish save energy by eliminating the circadian rhythm in metabolism. PLoS ONE. 2014;9:e107877. - PMC - PubMed
    1. Hüppop K. Oxygen consumption of Astyanax fasciatus (Characidae, Pisces): a comparison of epigean and hypogean populations. Environ. Biol. Fishes. 1986;17:299–308.

Publication types

MeSH terms