. 2018 Apr 5;556(7699):130-134.
doi: 10.1038/nature26139. Epub 2018 Mar 21.

Structural insights into the voltage and phospholipid activation of the mammalian TPC1 channel

Affiliations

Structural insights into the voltage and phospholipid activation of the mammalian TPC1 channel

Ji She et al. Nature. .

Abstract

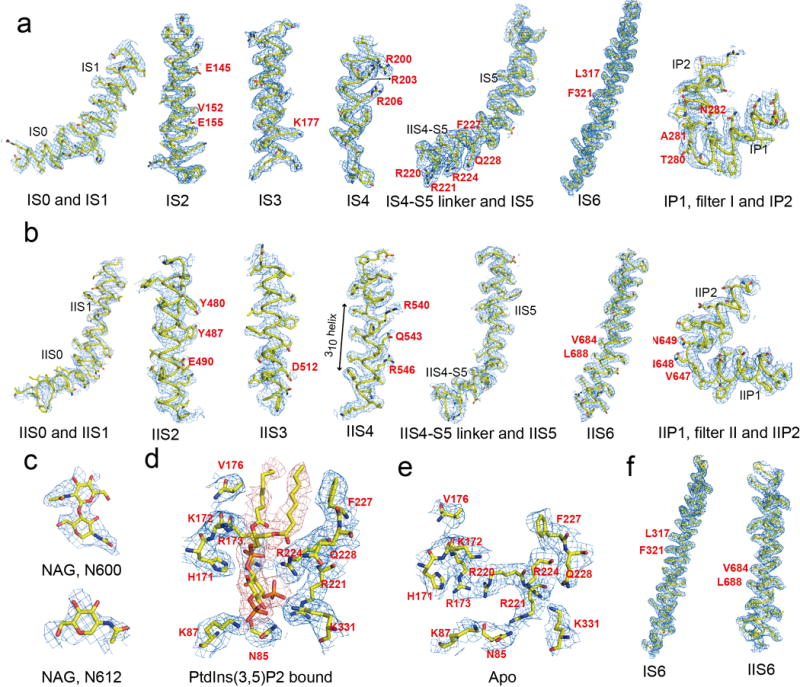
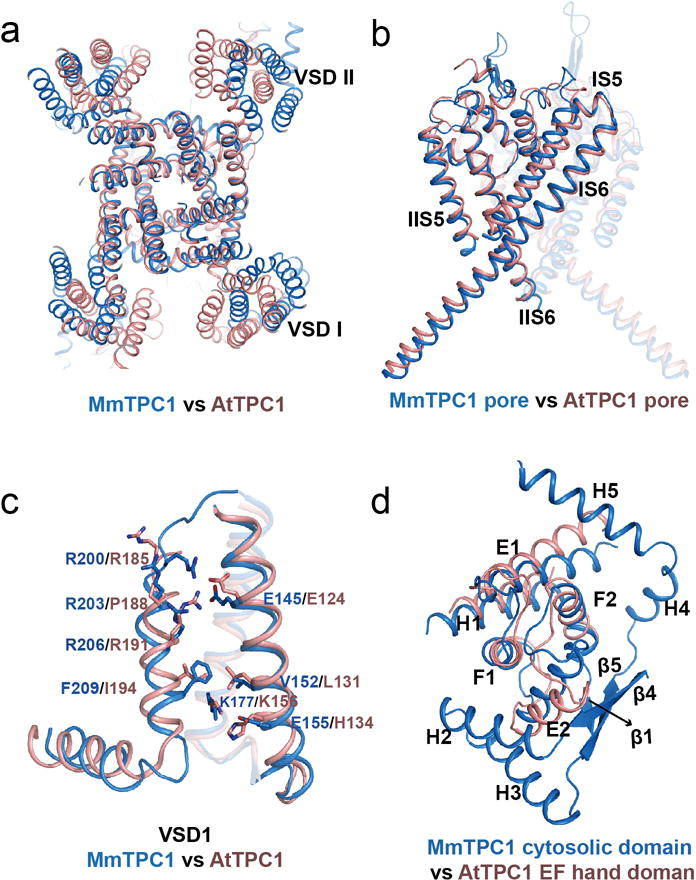
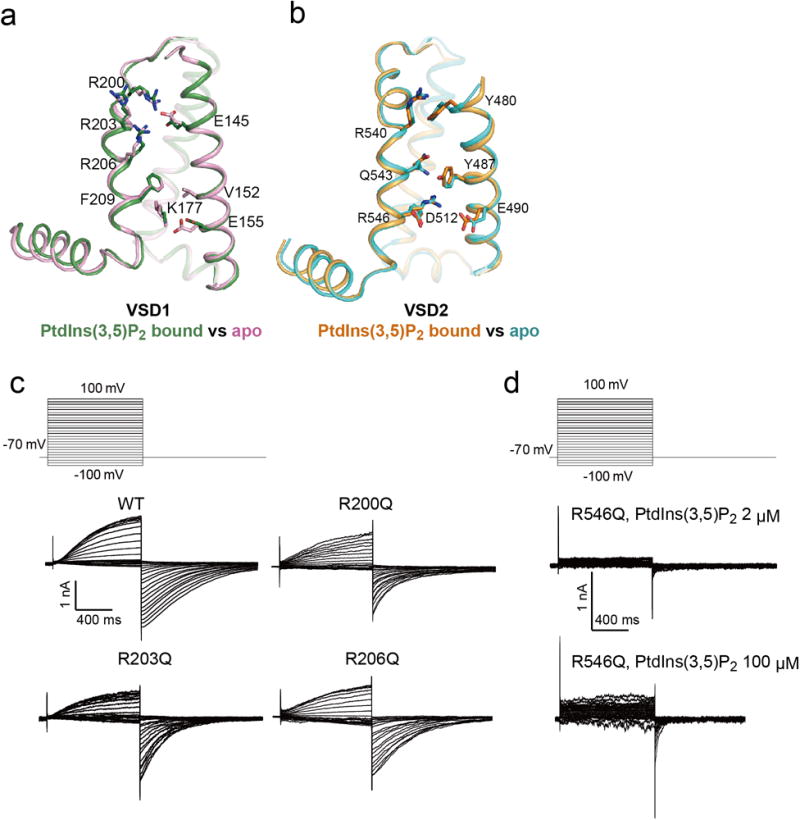
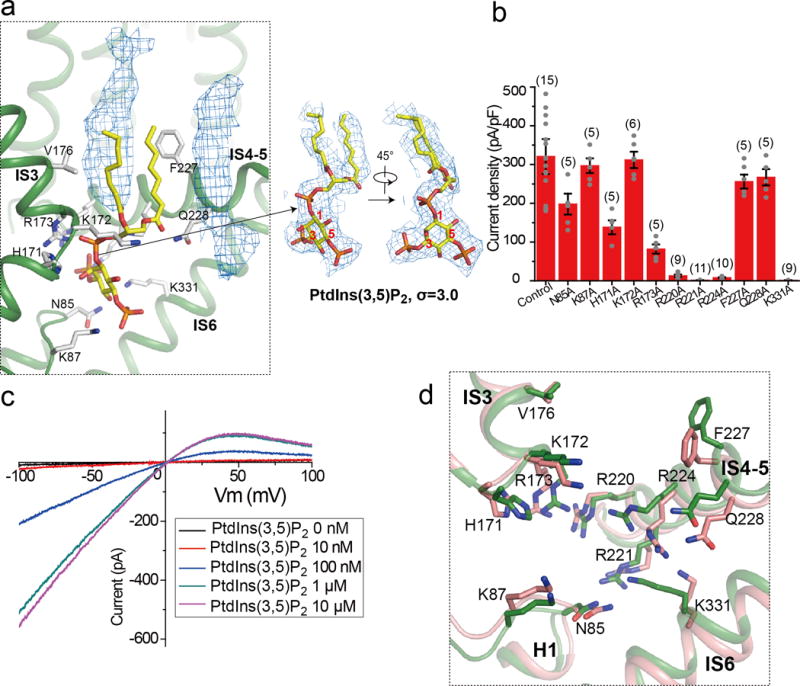
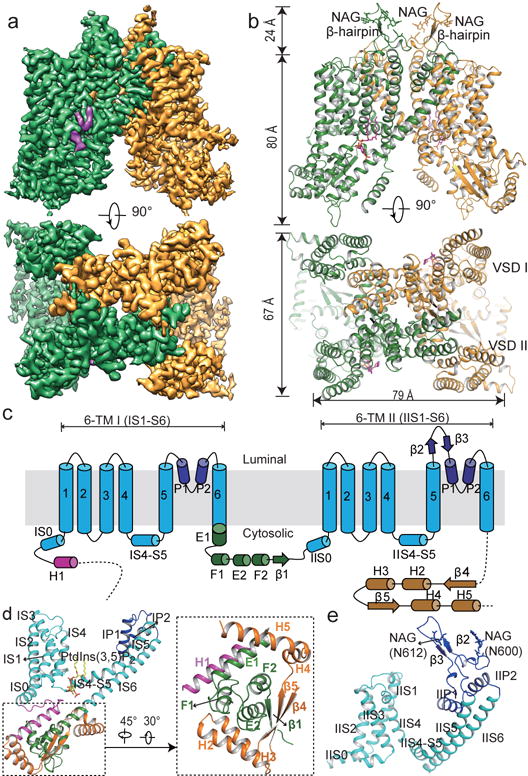
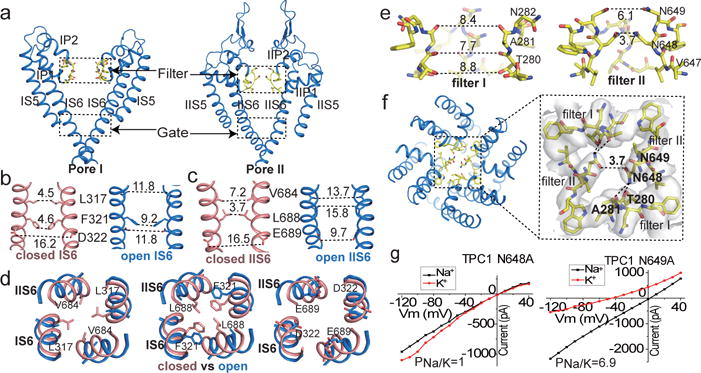
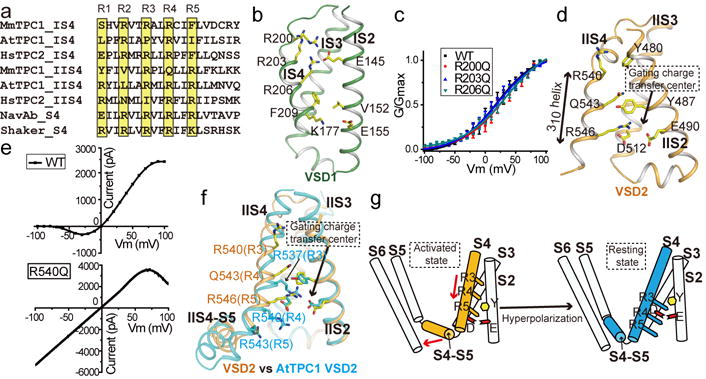
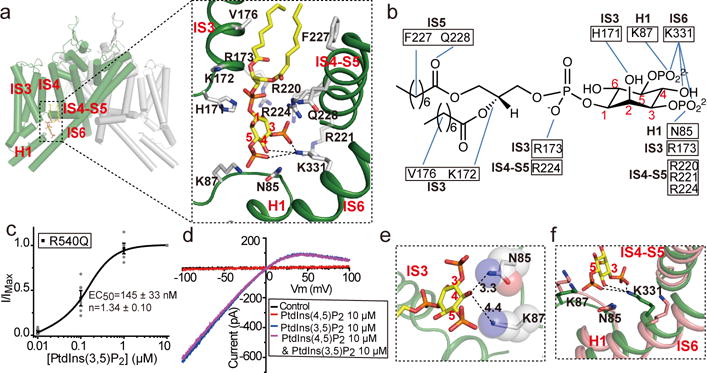
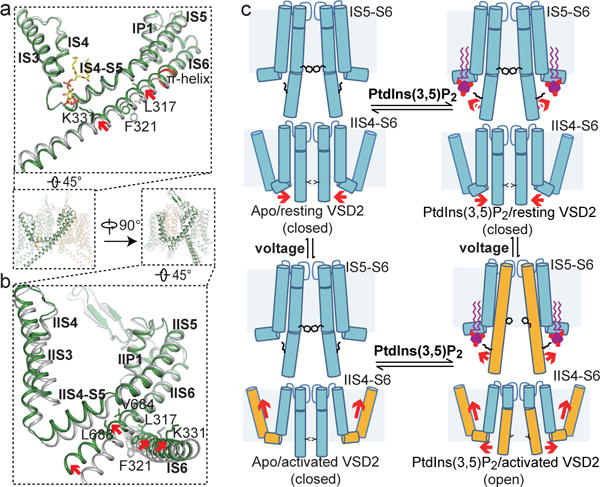
The organellar two-pore channel (TPC) functions as a homodimer, in which each subunit contains two homologous Shaker-like six-transmembrane (6-TM)-domain repeats. TPCs belong to the voltage-gated ion channel superfamily and are ubiquitously expressed in animals and plants. Mammalian TPC1 and TPC2 are localized at the endolysosomal membrane, and have critical roles in regulating the physiological functions of these acidic organelles. Here we present electron cryo-microscopy structures of mouse TPC1 (MmTPC1)-a voltage-dependent, phosphatidylinositol 3,5-bisphosphate (PtdIns(3,5)P2)-activated Na+-selective channel-in both the apo closed state and ligand-bound open state. Combined with functional analysis, these structures provide comprehensive structural insights into the selectivity and gating mechanisms of mammalian TPC channels. The channel has a coin-slot-shaped ion pathway in the filter that defines the selectivity of mammalian TPCs. Only the voltage-sensing domain from the second 6-TM domain confers voltage dependence on MmTPC1. Endolysosome-specific PtdIns(3,5)P2 binds to the first 6-TM domain and activates the channel under conditions of depolarizing membrane potential. Structural comparisons between the apo and PtdIns(3,5)P2-bound structures show the interplay between voltage and ligand in channel activation. These MmTPC1 structures reveal lipid binding and regulation in a 6-TM voltage-gated channel, which is of interest in light of the emerging recognition of the importance of phosphoinositide regulation of ion channels.


Conflict of interest statement

Author Information

The authors declare no competing financial interests.

Figures

Extended Data Figure 1
Extended Data Figure 1. Sequence alignment of MmTPC1, HsTPC1, AtTPC1, MmTPC2 and HsTPC2
Secondary structure assignments are based on the structure of PtdIns(3,5)P2-bound MmTPC1. Red dots mark the ligand binding residues; black dots mark the S4 arginine residues and residues at the gating charge transfer center; cyan dots mark the key S6 gating residues; green dots mark the residues predicted to participate in calcium coordination in EF-hand domains of AtTPC1. MmTPC1 and AtTPC1shares about 25% sequence identity.
Extended Data Figure 2
Extended Data Figure 2. Gating and selectivity of MmTPC1
a, Sample traces and current density (current/capacitance) of the wild type and L11A/I12A mutant of MmTPC1 recorded in the whole cell configuration with 100 μM PtdIns(3,5)P2 in the pipette (cytosolic). The experiments were repeated five times independently with similar results. Data points for current density are mean ± SEM (n=5 independent experiments). L11A/I12A mutant elicited much larger whole cell currents and therefore was used as the wild type channel in all our recordings. The extracellular side of MmTPC1 in plasma membrane is equivalent to the luminal side of MmTPC1 in lysosomes. b, Sample traces of PtdIns(3,5)P2-dependent voltage activation of MmTPC1. Whole cell currents were recorded with varying PtdIns(3,5)P2 concentrations in the pipette (cytosolic) at pH 7.4. The experiments were repeated five times independently with similar results. c, G/Gmax-V curves of MmTPC1 at various PtdIns(3,5)P2 concentrations. Boltzmann fit yields V1/2(mV)= 21.6 ± 1.2, 15.2 ± 1.0, 16.1 ± 0.9, −2.0 ± 1.0 and Z=0.78 ± 0.04, 0.82 ± 0.03, 0.89 ± 0.02, 0.84 ± 0.05 for voltage activation in 0.05, 0.2, 2.0, 10 μM cytosolic PtdIns(3,5)P2, respectively, where V1/2 is the membrane potential for half maximum activation and Z is apparent valence. All data points are mean ± SEM (n=5 independent experiments). d, Luminal pH modulates the voltage activation of MmTPC1. Whole cell currents of MmTPC1 recorded in the presence of 2 μM cytosolic PtdIns(3,5)P2 with varying luminal (bath) pH of 7.4, 6.0 or 4.6. Sample traces were obtained from the same patch. The experiments were repeated five times independently with similar results. e, G/Gmax-V curves of MmTPC1 at various luminal pH. Boltzmann fit yields V1/2= 16.2 ± 0.8 mV, Z= 0.91 ± 0.02 at pH 7.4, V1/2= 38.2 ± 1.2 mV, Z=0.95 ± 0.02 at pH 6.0. All data points were normalized against Gmax obtained at 100 mV activation voltage and pH 7.4. All data points are mean ± SEM (n=5 independent experiments). f, Sample traces of whole cell currents with 150 mM Na+ in the pipette solution and 150 mM X (X=150 mM Na+ or 145 mM K+ and 5 mM Na+) in the bath solution, and the I–V curves generated from the tail currents of the sample traces. g, Sample traces of whole cell currents with 150 mM Na+ in the pipette solution and 150 mM Na+ or 100 mM Ca2+ in the bath solution, and the I–V curves generated from the tail currents of the sample traces. Data in (f) and (g) were recorded with 10 μM PtdIns(3,5)P2 in the pipette at pH 7.4 and both experiments were repeated five times independently with similar results.
Extended Data Figure 3
Extended Data Figure 3. Structure determination of PtdIns(3,5)P2-bound MmTPC1
a, Representative electron micrograph of PtdIns(3,5)P2-bound MmTPC1 and 2348 micrographs were used for structure determination. b, Two-dimensional class averages. c, Euler angle distribution of particles used in the final three-dimensional reconstruction, with the heights of the cylinders corresponding to the number of particles. d, Final density maps colored by local resolution. e, Gold-standard FSC curves of the final 3D reconstructions. f, FSC curves for cross-validation between the models and the maps. Curves for model vs. summed map in black (sum), for model vs. half map in blue (work), and for model vs. half map not used for refinement in red (free). g, Flowchart of EM data processing for PtdIns(3,5)P2-bound MmTPC1 particles.
Extended Data Figure 4
Extended Data Figure 4. Structure determination of apo MmTPC1
a, Representative electron micrograph of apo MmTPC1 and 2937 micrographs were used for structure determination. b, Two-dimensional class averages. c, Euler angle distribution of particles used in the final three-dimensional reconstruction, with the heights of the cylinders corresponding to the number of particles. d, Final density maps colored by local resolution. e, Gold-standard FSC curves of the final 3D reconstructions. f, FSC curves for cross-validation between the models and the maps. Curves for model vs. summed map in black (sum), for model vs. half map in blue (work), and for model vs. half map not used for refinement in red (free). g, Flowchart of EM data processing for apo MmTPC1 particles.
Extended Data Figure 5
Extended Data Figure 5. Sample EM density maps (blue mesh) for MmTPC1
ad, Sample EM density maps for various parts of PtdIns(3,5)P2-bound MmTPC1: IS1-S6 and filter I (a), IIS1-S6 and filter II (b), NAGs of Asn600 and Asn612 (c), PtdIns(3,5)P2 binding site (d). The maps are low-pass filtered to 3.2 Å and sharpened with a temperature factor of −105 Å2. e and f, Sample EM density maps for the key parts of Apo MmTPC1: ligand binding site (e) and S6 helices (f). The maps are low-pass filtered to 3.4 Å and sharpened with a temperature factor of −98.5 Å2. Residues discussed in main text are labeled in red.
Extended Data Figure 6
Extended Data Figure 6. Structure comparison between MmTPC1 and AtTPC1
a, Superposition of the overall structures of MmTPC1 (marine) and AtTPC1(salmon). b, Superposition of the pore regions. c, Superposition of VSD1 domains. The comparison of the VSD2 domains is shown in figure 3f. d, superposition of cytosolic soluble domains.
Extended Data Figure 7
Extended Data Figure 7. Sample traces of whole cell currents for N648A and N649A filter mutants
The pipette solution contained 150 mM Na+ and the bath solution contained 150 mM Na+ or 145 mM K+/5 mM Na+. The tail currents were used to generate the I–V curves shown in Figure 2g. The experiments were repeated five times independently with similar results.
Extended Data Figure 8
Extended Data Figure 8. Voltage sensing domains
a, Superimposition of MmTPC1 VSD1 structures in the PtdIns(3,5)P2-bound (green) and apo (pink) states with S1 helices removed for clarity. The MmTPC1 VSD1 lacks some key features of canonical voltage sensors: the conserved aromatic residue on S2 and acidic residue on S3 that form the gating charge transfer center become V152 and Lys177, respectively, in MmTPC1; the conserved basic residue at the R5 position becomes Phe209 in MmTPC1; no arginine from IS4 is positioned in the gating charge transfer center. b, Superimposition of MmTPC1 VSD2 structures in the PtdIns(3,5)P2-bound (orange) and apo (cyan) states. c, Sample traces of voltage activation of MmTPC1 and its IS4 arginine mutations recorded in the whole cell configuration with 2 μM PtdIns(3,5)P2 in the pipette. Peak tail currents were used to generate the G/Gmax-V curves shown in Figure 3c. The experiments were repeated five times independently with similar results. d, Sample traces of voltage activation of R546Q mutation recorded in the whole cell configuration with 2 μM and 100 μM PtdIns(3,5)P2 in the pipette. The experiments were repeated five times independently with similar results.
Extended Data Figure 9
Extended Data Figure 9. PtdIns(3,5)P2 binding in MmTPC1
a, Model of bound PtdIns(3,5)P2 (left panel) and its EM density (right panel). Density of two other membrane lipid molecules (blue mesh in the left panel) was also observed near PtdIns(3,5)P2 in the structure. b, Current density of mutations at the PtdIns(3,5)P2-binding site measured at −100 mV in whole cell recordings. All mutants were generated on the background of Arg540Gln mutant which is used as control. All data points are mean ± SEM with the number of independent experiments for each mutant shown in bracket. c, Sample I-V curves of Arg540Gln mutant recorded in excised patches with varying PtdIns(3,5)P2 concentrations in the bath (cytosolic). The experiments were repeated five times independently with similar results. Currents at −100mV were used to generate the concentration dependent PtdIns(3,5)P2 activation curve shown in Figure 4c. Imax is the current recorded at −100 mV with 10 μM PtdIns(3,5)P2 in the bath. d, Structural comparison at the ligand binding site between the PtdIns(3,5)P2-bound (green) and apo (salmon) states.
Figure 1
Figure 1. Overall structure of MmTPC1
a, 3D reconstruction of PtdIns(3,5)P2-bound (purple density) MmTPC1 dimer with each subunit in individual color. b, Cartoon representation of MmTPC1 in the same orientations as the EM maps in a. N-acetylglucosamine (NAG) molecules and PtdIns(3,5)P2 are shown as sticks. c, Topology and domain arrangement of MmTPC1 subunit. d, Structure of the 6-TM I and the soluble domain with individual element colored as that in c. Inset: zoomed-in view of the cytosolic soluble domain. e, Structure of the 6-TM II.
Figure 2
Figure 2. Ion conduction pore of MmTPC1
a, Ion conduction pore comprising IS5-S6 (pore 1) and IIS5-S6 (pore 2). b and c, Side view of the bundle crossing formed by IS6 (b) and IIS6 (c) in the apo closed (salmon) and PtdIns(3,5)P2-bound open (blue) states. Numbers are cross distances (in Å) at the constriction points. d, Structural comparison of the cytosolic gate between the closed and open states viewed from the cytosolic side in three sections: L317/V684 (left), F321/L688 (middle) and D322/E689 (right). e, Side view of the selectivity filter formed by filter I and filter II with the front subunit removed for clarity. f, Top view of the selectivity filter. Inset: zoomed-in view of the filter with the stabilization H-bonds for N648 (dotted line) and EM-density (grey) shown. g, Sample I–V curves of the filter mutations recorded with high Na+ or K+ in the bath solution. Original traces are shown in Extended Data Fig. 7. The experiments were repeated five times independently with similar results.
Figure 3
Figure 3. The voltage-sensing domains
a, Partial S4 sequence alignment and arginine registry. b, Side view of VSD1 with IS1 omitted for clarity. c, G/Gmax-V curves of wild-type MmTPC1 and IS4 arginine mutations. Sample traces are shown in Extended Data Fig. 8. All data points are mean ± SEM (n=5 independent experiments). d, Side view of VSD2 with IIS1 omitted for clarity. e, Sample I–V curves of wild-type MmTPC1 (obtained from the peak currents at various activation potentials) and Arg540Gln mutant (obtained by applying voltage pulses ramp from −100 to +100 mV). Currents were recorded with 2 μM PtdIns(3,5)P2 in the pipette and repeated five times independently with similar results. f, Structural comparison of VSD2 between the PtdIns(3,5)P2-bound MmTPC1 (orange) and AtTPC1 (cyan) with S1 helices omitted for clarity. g, Cartoon representation of VSD2 conformational change from the activated to resting state. Red arrows indicate the concurrent movements of S4 and S4–S5 linker.
Figure 4
Figure 4. PtdIns(3,5)P2 binding in MmTPC1
a, PtdIns(3,5)P2 binding in 6-TM I of MmTPC1. Inset: zoomed-in view of the PtdIns(3,5)P2 site. b, Schematic diagram of the protein-ligand interactions. c, Concentration dependent PtdIns(3,5)P2 activation of Arg540Gln mutant at −100 mV. Curve is least square fit to the Hill equation. Data points are mean ± SEM (n=5 independent experiments). Sample I–V curves are shown in Extended Data Fig. 9c. d, Ligand specificity of MmTPC1 measured using Arg540Gln mutant. Sample I–V curves were recorded on the same patch with different PtdInsP2 isoforms. The experiments were repeated five times independently with similar results. e, Close proximity between the C4 hydroxyl of PtdIns(3,5)P2 and the surrounding residues. f, Structural comparison at the region around Lys331 between the apo (green) and PtdIns(3,5)P2-bound MmTPC1 (salmon).
Figure 5
Figure 5. Gating mechanism of MmTPC1
a and b, Structural comparison between the apo closed (grey) and PtdIns(3,5)P2-bound open (green) MmTPC1 with zoomed-in views of the IS3-S6 (a) and IIS3-S6 (b) regions. Arrows indicate the S6 movements. Key gating residues are shown as sticks. IS6 contains a 5-residue π-helix (colored in red). c, Working model for voltage-dependent PtdIns(3,5)P2 activation of MmTPC1. Red arrows mark the direction of the driving force.

Comment in

  • Two-pore channels open up.
    Patel S. Patel S. Nature. 2018 Apr 5;556(7699):38-40. doi: 10.1038/d41586-018-02783-8. Nature. 2018. PMID: 29620760 No abstract available.

Similar articles

Cited by

References

    1. Rahman T, et al. Two-pore channels provide insight into the evolution of voltage-gated Ca2+ and Na+ channels. Sci Signal. 2014;7:ra109. doi: 10.1126/scisignal.2005450. - DOI - PMC - PubMed
    1. Yu FH, Catterall WA. The VGL-chanome: a protein superfamily specialized for electrical signaling and ionic homeostasis. Sci STKE. 2004;2004:re15. doi: 10.1126/stke.2532004re15. - DOI - PubMed
    1. Ishibashi K, Suzuki M, Imai M. Molecular cloning of a novel form (two-repeat) protein related to voltage-gated sodium and calcium channels. Biochem Biophys Res Commun. 2000;270:370–376. doi: 10.1006/bbrc.2000.2435. - DOI - PubMed
    1. Furuichi T, Cunningham KW, Muto S. A putative two pore channel AtTPC1 mediates Ca(2+) flux in Arabidopsis leaf cells. Plant Cell Physiol. 2001;42:900–905. - PubMed
    1. Patel S. Function and dysfunction of two-pore channels. Sci Signal. 2015;8:re7. doi: 10.1126/scisignal.aab3314. - DOI - PubMed

Publication types