. 2018 Mar 29;555(7698):678-682.
doi: 10.1038/nature26140. Epub 2018 Mar 21.

The protein histidine phosphatase LHPP is a tumour suppressor

Affiliations

The protein histidine phosphatase LHPP is a tumour suppressor

Sravanth K Hindupur et al. Nature. .

Abstract

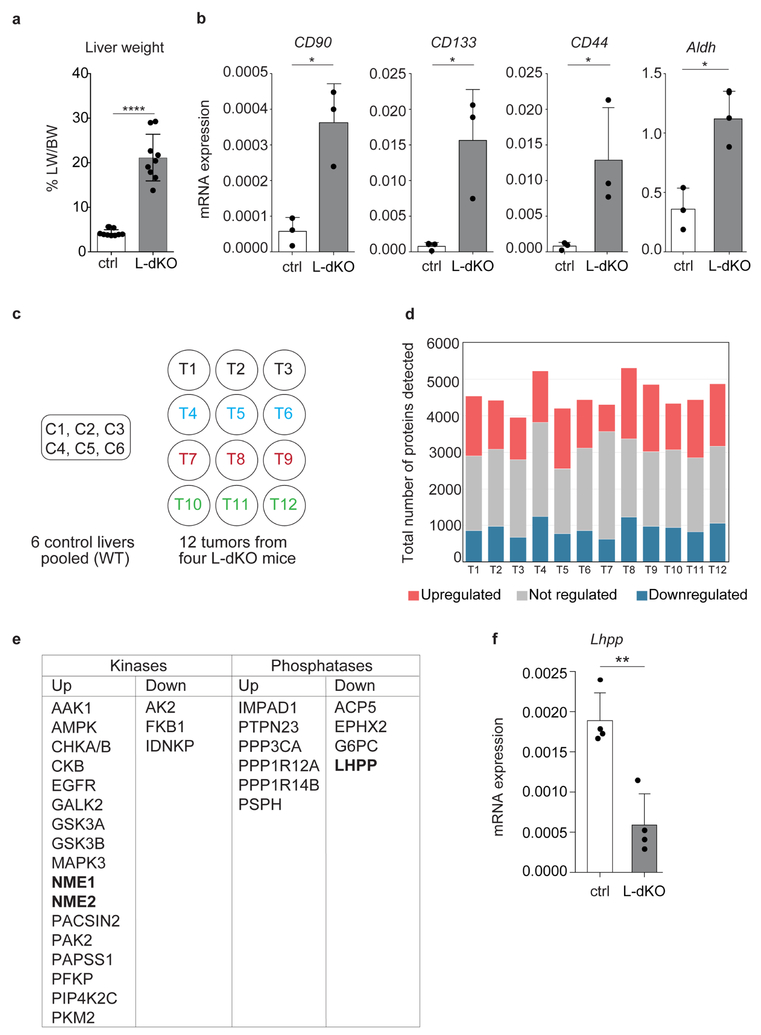
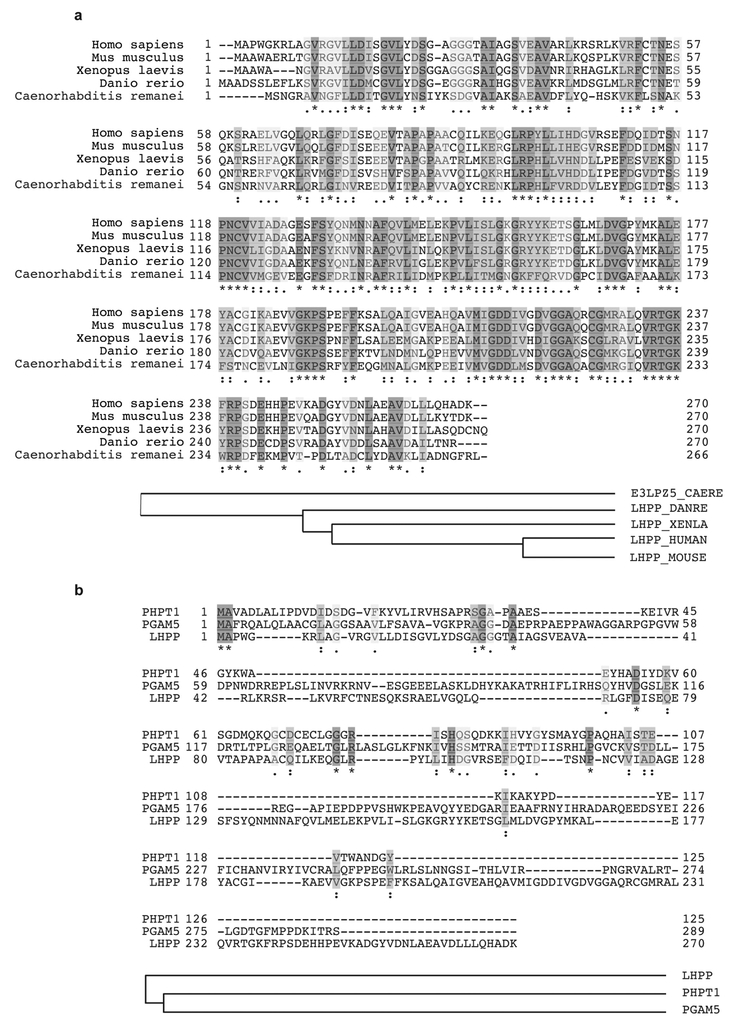
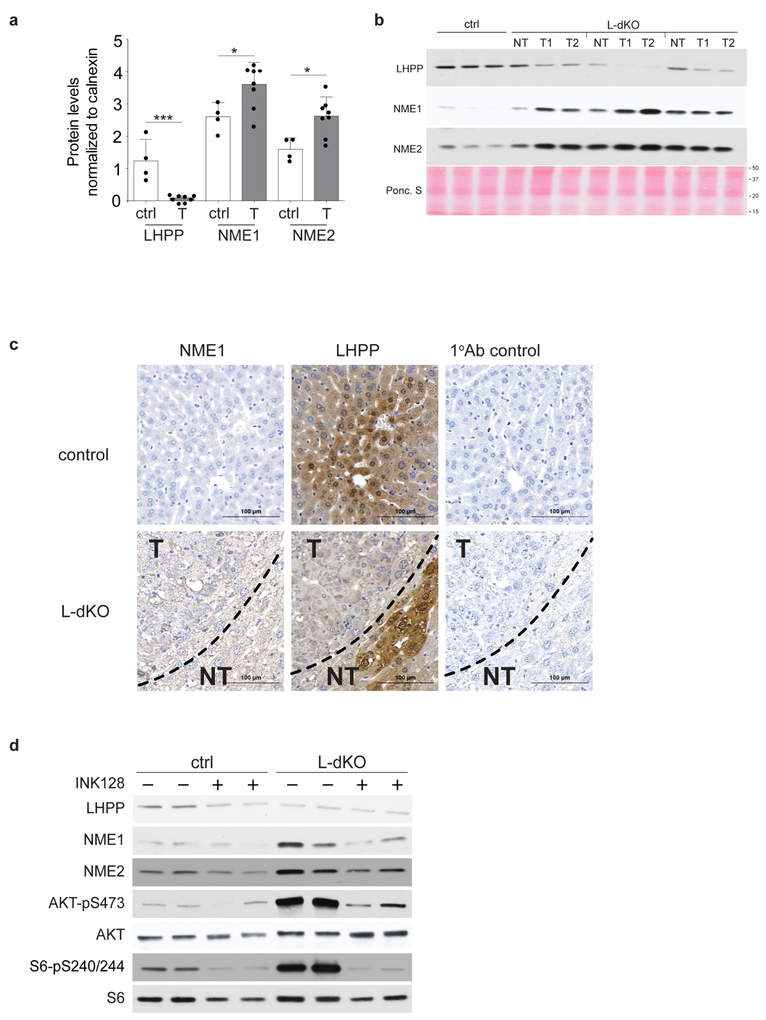
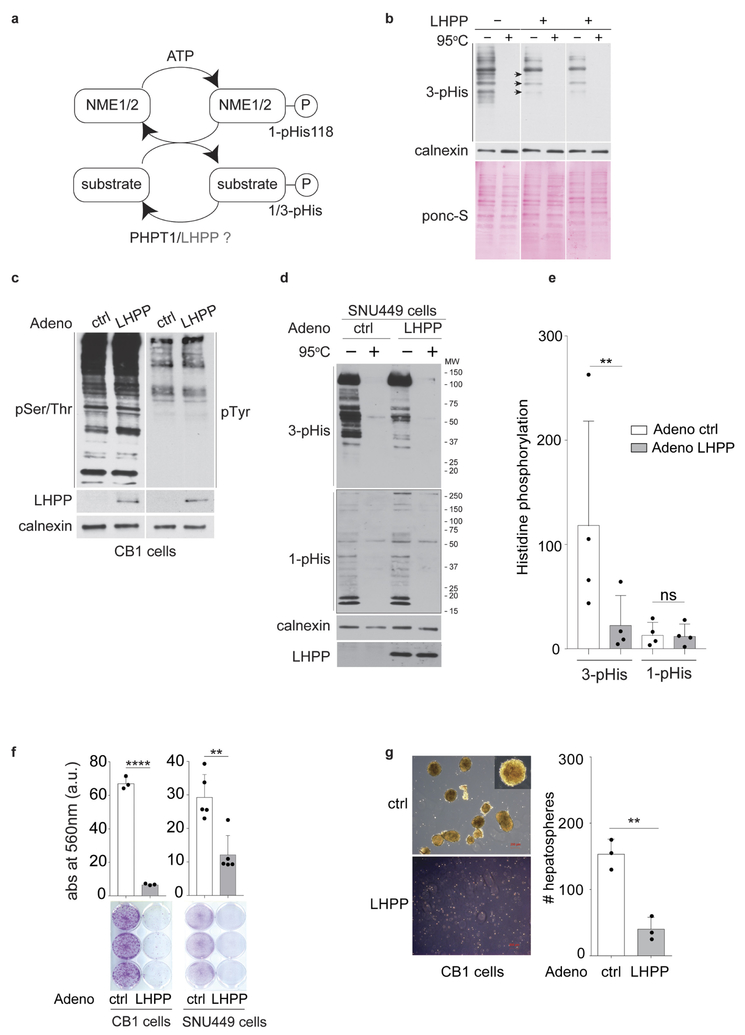
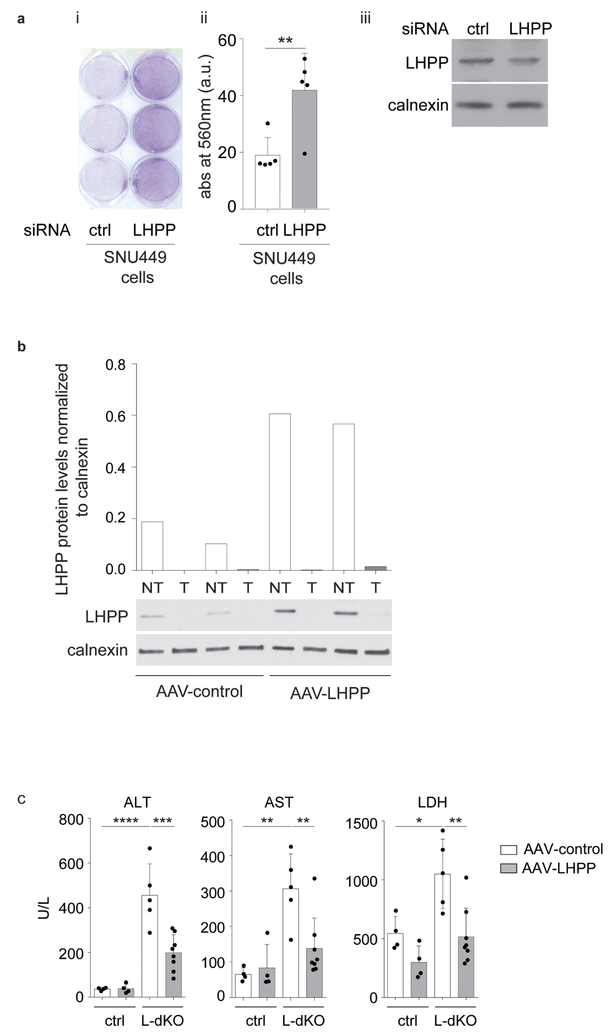
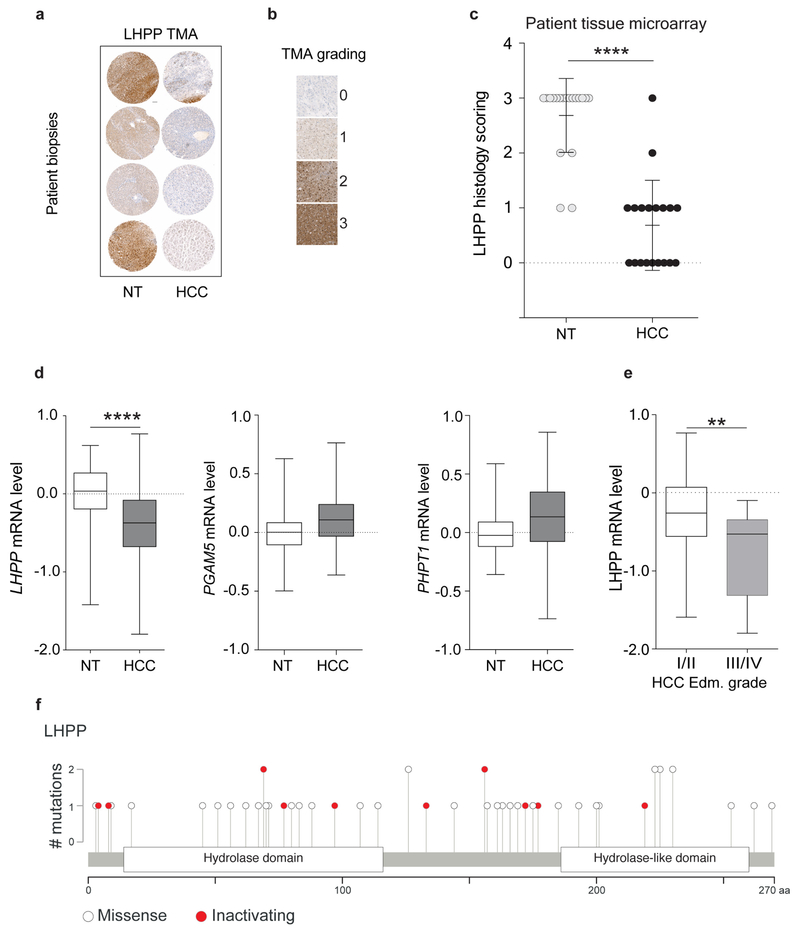
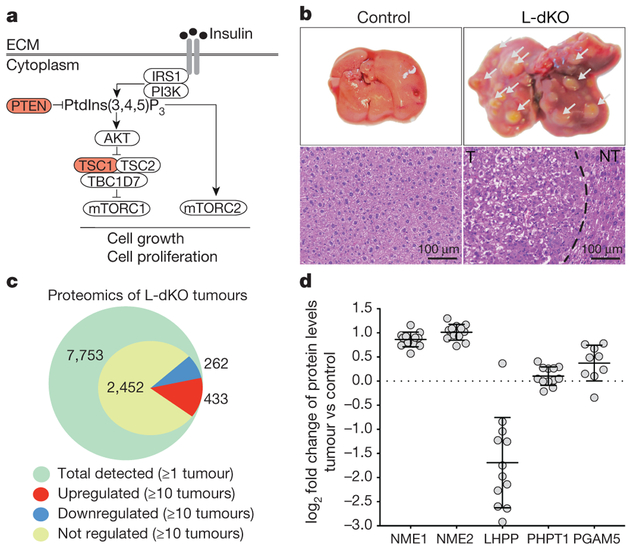
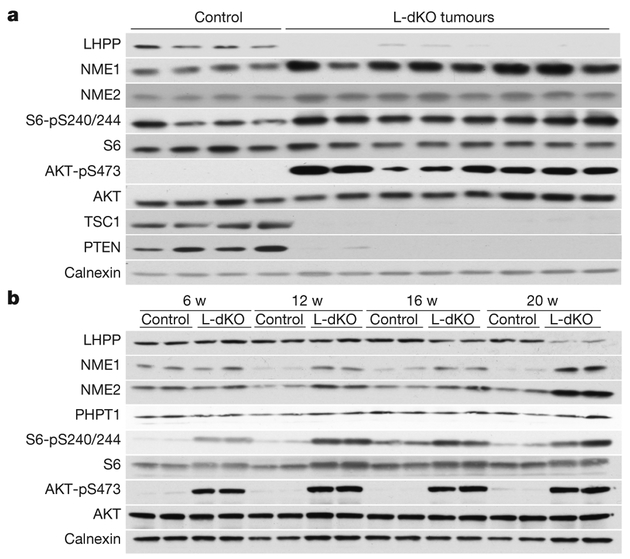
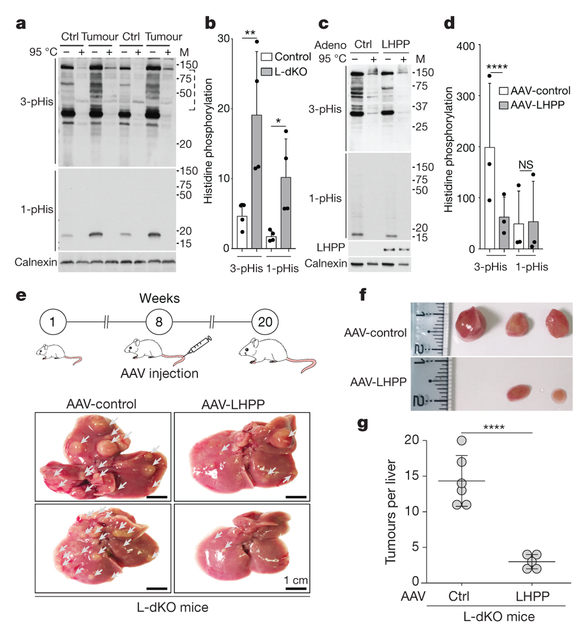
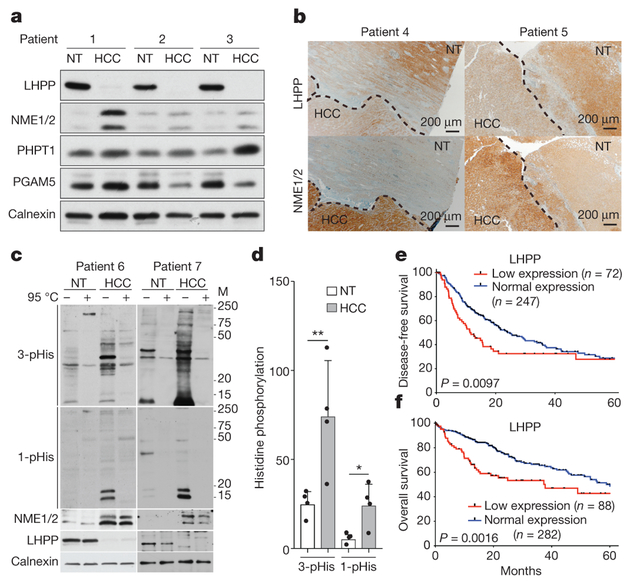
Histidine phosphorylation, the so-called hidden phosphoproteome, is a poorly characterized post-translational modification of proteins. Here we describe a role of histidine phosphorylation in tumorigenesis. Proteomic analysis of 12 tumours from an mTOR-driven hepatocellular carcinoma mouse model revealed that NME1 and NME2, the only known mammalian histidine kinases, were upregulated. Conversely, expression of the putative histidine phosphatase LHPP was downregulated specifically in the tumours. We demonstrate that LHPP is indeed a protein histidine phosphatase. Consistent with these observations, global histidine phosphorylation was significantly upregulated in the liver tumours. Sustained, hepatic expression of LHPP in the hepatocellular carcinoma mouse model reduced tumour burden and prevented the loss of liver function. Finally, in patients with hepatocellular carcinoma, low expression of LHPP correlated with increased tumour severity and reduced overall survival. Thus, LHPP is a protein histidine phosphatase and tumour suppressor, suggesting that deregulated histidine phosphorylation is oncogenic.


Conflict of interest statement

The authors declare no competing financial interests. Readers are welcome to comment on the online version of the paper.

Figures

Extended Data Figure 1 |
Extended Data Figure 1 |. Proteomics on L-dKO tumours.
a, Liver weight (LW) to body weight (BW) ratio (percentage) of 20-week-old L-dKO mice (n = 9) and age-matched control mice (n = 9). ****P < 0.0001, two-sided unpaired t-test. b, mRNA expression analysis in 20-week-old L-dKO tumours (n = 3) compared to livers from age-matched control mice (n = 3). CD90 (also known as Thy1; *P = 0.0104), CD133 (also known as Prom1; *P = 0.0227), Cd44 (*P = 0.0473) and Aldh1 (also known as Aldh1a1; *P = 0.0107), two-sided unpaired t-test. Data are mean ± s.d. c, Diagram showing the scheme used for mass spectrometry-based proteomic analysis. Hepatic proteomes from control mice (n = 6) were combined and used as a pooled control against tumours (n = 12) from four different L-dKO mice. d, Graph showing number of proteins upregulated (red), downregulated (blue) and not regulated (grey) in 12 tumours from c. ANOVA-based two-sample t-test with a FDR of 2%, S0 = 1 was used to determine regulation (n = 12). e, List of kinases and phosphatases (including putative phosphatases) regulated in a minimum of 10 out of 12 tumours. f, Lhpp mRNA expression analysis in 20-week-old L-dKO tumours compared to livers from age-matched control mice (n = 4). P = 0.0022, two-sided unpaired t-test. Data are mean ± s.d.
Extended Data Figure 2 |
Extended Data Figure 2 |. LHPP protein is conserved in eukaryotes.
a, LHPP protein is highly conserved in eukaryotes, from worm to human. b, Human LHPP protein shows weak homology to known human histidine phosphatases PHPT1 and PGAM5.
Extended Data Figure 3 |
Extended Data Figure 3 |. Loss of LHPP expression is confined to L-dKO tumours.
a, Quantification of immunoblot (from Fig. 2a) indicates reduced LHPP (***P = 0.0004) and increased NME1 (*P = 0.0254) and NME2 (*P = 0.0105) expression in tumours compared to age-matched control littermates (band intensities in each lane are normalized to intensity of corresponding calnexin protein levels), control mice (n = 4), L-dKO tumours (n = 8). P values are from a two-sided unpaired t-test. Data are mean ± s.d. b, Immunoblot analysis ofliver tumour (n = 6)and non-tumour (n = 3) tissue from three independent 20-week-old L-dKO mice shows tumour-specific loss of LHPP expression. Ponceau S image of the whole blot is also included. For full scan, see Supplementary Fig. 3. c, Immunohistochemistry analyses showing increased NME1 expression in L-dKO liver compared to liver from control mice. Although L-dKO tumours displayed reduced expression of LHPP, hepatic LHPP expression in the non-tumour region was comparable to control mice. Parallel tissue sections that were processed similarly (without primary antibody) served as antibody control. Similar results were obtained in livers from 4 independent control mice and L-dKO mice. d, Immunoblot analysis of liver from control mice and L-dKO liver tumours treated with INK128 (1 mg kg−1 body weight; two intraperitonial injections in 24 h; n = 4 mice per condition, lysates from two mice are pooled into one lane). LHPP expression remains unchanged, but NME1 and NME2 expressionis reduced considerably in L-dKO mice after INK128 treatment. For full scans, see Supplementary Fig. 4.
Extended Data Figure 4 |
Extended Data Figure 4 |. LHPP is a protein histidine phosphatase.
a, Diagram of NME1 and NME2 autophosphorylation on His118. The high-energy phosphate is later transferred from the histidine kinase dimer pair to the histidine on the substrate. b, CB1 cell lysate was electrophoresed and transferred onto a nitrocellulose membrane. Two sets of the membrane were treated with recombinant full-length LHPP (for 4 h) in TMD buffer (see Methods) and the other set of the membrane was treated with plain TMD buffer (pH 8.5). Immunoblotting analysis of both the membranes with 3-pHis antibody (clone SC44–1) indicates that LHPP is a protein pHis phosphatase. For full scans, see Supplementary Fig. 6.c, Immunoblotting shows no apparent change pSer/Thr or pTyr levels in CB1 cells infected with adenovirus containing LHPP compared to cells infected with RFP-only control. Similar result was observed in two independent experiments. For full scans, see Supplementary Fig. 9. d, e, Immunoblotting (d) and quantification (e) show a reduction in 3-pHis levels in SNU449 cells infected with adenovirus containing LHPP compared to control-infected cells. Similar results were observed in four independent biological experiments. For full scans, see Supplementary Fig. 8. A 50–60% confluent dish was first infected, 24 h after infection, the cells were trypsinized and 2 × 10⁵ cells were seeded into a 6-well adherent tissue culture dish and 24 h later lysed in pHis compatible buffer (see Methods). The monoclonal antibodies used to detect 3-pHis and 1-pHis were SC44–1 and SC1–1, respectively (n = 4). **P = 0.0019, two-sided ratio paired t-test. Data are mean ± s.d. f, Colony-forming assay in CB1 cells (n = 3 biologically independent experiments) and SNU449 (n = 5 biologically independent experiments) cells shows reduced proliferation upon LHPP over expression. Twelve hours after infection, CB1 (2 × 10⁴ per well) and SNU449 (4 × 10⁴ per well) cells were seeded into a 6-well plate tissue culture plate and stained with crystal violet (2% crystal violet in 20% methanol) on day 7. **P = 0.0026, ****P < 0.0001, two-sided unpaired t-test. Data are mean ± s.d. See Methods for further details. g, Photomicrographs of LHPP-overexpressing CB1 cells (left) displayed reduced ability to form hepatospheres in ultralow attachment plates; n = 3 biologically independent experiments.**P = 0.0024, two-sided unpaired t-test. Data are mean ± s.d. (see Methods).
Extended Data Figure 5 |
Extended Data Figure 5 |. LHPP is a tumour suppressor.
a, Left and middle, colony-forming assay in SNU449 cells shows increased proliferation upon LHPP knockdown using pooled short interfering RNA (siRNA). Then 36 h after infection, SNU449 cells were re-transfected with LHPP siRNA and 4 × 10⁴ cells per well were seeded into a 6-well tissue culture plate and allowed to proliferate for another 3 days. At the end of the third day, cells were stained with crystal violet (2% crystal violet in 20% methanol), and similar results were obtained from five biologically independent experiments. **P = 0.0075, two-sided unpaired t-test. Data are mean ± s.d. Right, immunoblot analysis (n = 1) revealed a reduction in LHPP protein levels after siRNA transfection. Longer exposure ofthe LHPP blot relative to the blot in Extended Data Fig. 4d. In addition to immunobloting, a reduction in LHPP transcript levels after siRNA transfection was also confirmed in two independent experiments (data not shown). For full scans, see Supplementary Fig. 10. b, Immunoblot analysis (bottom) and quantification (top) of non-tumour and tumour liver lysates confirmed LHPP overexpression in 20-week-old AAV-LHPP-infected mice (as in Fig. 3e). For full scans, see Supplementary Fig. 11.c, Serum extracted from mice in (Fig. 3e) and analysed for ALT, AST and LDH levels shows a reduction in liver damage upon AAV-LHPP infection, unit per litre (U l−1) (control mice infected with AAV-control and AAV-LHPP virus (n = 4), L-dKO mice infected with AAV-control (n = 5) and AAV-LHPP virus (n = 8)). Data are mean ±s.d. P values are by one-way ANOVA with Tukey’s multiple-comparison test. ALT (adjusted ***P = 0.004, ****P< 0.0001), AST (adjusted **P = 0.013 for control mice versus L-dKO mice transfected with AAV-control; adjusted **P = 0.0075 for L-dKO mice transfected with AAV-control versus L-dKO mice transfected with AAV-LHPP), LDH (adjusted *P = 0.0196, **P = 0.0037).
Extended Data Figure 6 |
Extended Data Figure 6 |. LHPP is a tumour suppressor in human HCC.
a, Representative immunohistochemistry images from the LHPP-stained tissue microarray. Scale bar, 100 μm. b, Representative images and staining intensities of LHPP staining in the tissue microarray. c, Tissue microarray (TMA) indicates that LHPP is significantly downregulated in human HCC compared to adjacent non-tumour tissue (n = 20 HCC patients, ****P < 0.0001, two-sided paired t-test). d, Box plots showing a significant reduction in LHPP expression in HCC tissue compared to adjacent non-tumour tissue (n = 59). ****P < 0.0001, two-sided Mann-Whitney U test. Non-tumour (minimum, −1.422, median, 0.03329, maximum, 0.6179, lower 95% confidence interval (CI) of mean −0.0931, upper 95% CI of mean 0.0931) and HCC (minimum, −1.797, median, −0.3729, maximum, 0.7683, lower 95% CI of mean −0.5328, upper 95% CI of mean −0.2506). Expression of PHPT1 and PGAM5 was not reduced in HCC. e, Box plots showing a strong reduction in LHPP expression in Edmondson grade III/IV tumours (aggressive tumours, n = 17) compared to Edmondson grade I/II tumours (less aggressive tumours, n = 42).**P = 0.0036, two-sided Mann-Whitney U test. Edmondson grade I/II (minimum, −1.592, median, −0.2594, maximum 0.7683, lower 95% CI of mean −0.3987, upper 95% CI of mean −0.0986) and III/IV (minimum, −1.797, median, −0.5281, maximum, −0.09671, lower 95% CI of mean −1.018, upper 95% CI of mean −0.4717). f, Lollipop plot showing the distribution of mutations in LHPP across pan-cancer datasets in the TCGA and ICGC portal. Solid white circles indicate missense mutations, red circles indicate inactivating mutations (including nonsense mutations, splice site mutations and frameshift deletions; detailed list of mutations is provided in Supplementary Table 5).
Figure 1 |
Figure 1 |. Proteomics on L-dKO tumours.
a, Diagram of mTOR signalling showing TSC and PTEN tumour suppressors. b, Top, representative images of whole livers from 20-week-old L-dKO (tumours indicated with arrowheads) and control mice. Bottom, representative photomicrographs of haematoxylin and eosin (H&E)-stained liver from control mice, tumour (T) and adjacent non-tumour (NT) tissue from L-dKO mice (20 weeks). Similar results were obtained in tumours from nine mice. c, Number of tumour proteins detected and quantified by mass spectrometry. A total of 7,753 proteins were quantified in all tumours (n = 12). 3,147 proteins were quantified in a minimum of 10 tumours, of which 433 proteins were upregulated (red), 262 were downregulated (blue), and 2,452 were unchanged (yellow). ANOVA-based two-sample t-test with a false discovery rate (FDR) of 2% was used to determine regulation. d, Mass spectrometry-determined fold change in independent L-dKO tumours (n = 12 for NME1, NME2, LHPP and PHPT1; n = 9 for PGAM5) compared to control livers (n = 6); data are mean ± s.d. PHPT1 and PGAM5 are two defined mammalian histidine phosphatases.
Figure 2 |
Figure 2 |. Loss of LHPP expression is confined to L-dKO tumours.
a, Immunoblot analysis indicates reduced LHPP and increased NME1and NME2 expression in tumours compared to age-matched littermate control (liver samples from control mice (n = 4) and two tumour samples each from four 20-week-old L-dKO mice (n = 8)). For full scans, see Supplementary Fig. 1. b, Immunoblot analysis indicates reduced LHPP expression (16 and 20 weeks (w)) and increased NME1 and NME2 expression (12, 16 and 20 weeks) in L-dKO liver (6, 12 and 16 weeks) and tumours (20 weeks) compared to age-matched control mice (6, 12 and 16 weeks, n = 4, liver tissues from two mice are pooled per lane). For full scans, see Supplementary Fig. 2.
Figure 3 |
Figure 3 |. LHPP is a protein histidine phosphatase and a tumour suppressor.
a, b, Immunoblot analysis (a) and quantification (b), shows increased 3-pHis and 1-pHis signals in L-dKO tumours (20 weeks) compared to control (ctrl) littermates. Similar results were observed in tumours from L-dKO mice (n = 4). Tissue lysates in 2× sample buffer (pH 8.8) heated at 95 °C for 10 min were dephosphorylated and served as a control. For full scans, see Supplementary Fig. 5. In the 3-pHis blot, the area enclosed in the dashed line was used for quantification (n = 4). Adjusted *P = 0.0460, **P = 0.0051, two-sided, Holm-Sidak’smultiple comparisons test. Data are mean ± s.d. M, molecular mass. c, Immunoblotting shows a reduction in 3-pHis levels in CB1 cells infected with adenovirus (adeno) containing LHPP, compared to cells infected with a control adenovirus. Similar results were observed in three biological experiments. For full scans, see Supplementary Fig. 7. d, Quantification of immunoblots indicate that 3-pHis signals are significantly reduced upon LHPP re-expression compared to control-infected cells (n = 3 biological repeats). ****P < 0.0001, two-sided ratio paired t-test. NS, not significant. Data are mean ± s.d. e, Top, experimental timeline. AAV-control or AAV-LHPP was injected into the tail vein of 8-week-old L-dKO and littermate control mice. Bottom, representative images of whole livers showing reduction in L-dKO liver tumour burden after infection with AAV-LHPP compared to infection with AAV-control (arrowheads indicate tumours). Similar results were observed in five different L-dKO mice infected with AAV-LHPP. f, Photographs of tumours isolated from L-dKO mice infected with AAV-LHPP and AAV-control. g, Quantification of tumours in L-dKO mice showing a significant reduction in tumour burden after infection with AAV-LHPP (n = 5 mice), compared to AAV-control (n = 6 mice). ****P < 0.0001, two-sided unpaired t-test. Data are mean ± s.d.
Figure 4 |
Figure 4 |. Loss of LHPP expression in human HCC correlates with reduced patient survival.
a, b, Immunoblot (n = 3 patients) (a) and immunohistochemistry (b) (n = 2 patients) analyses showing reduced LHPP and increased NME1 and NME2 expression in liver tissue from patients with HCC compared to adjacent non-tumour liver tissue in a total of n = 7 HCC patients (n = 2 other patients in panel c). For full scans, see Supplementary Fig. 12. c, Immunoblot analysis showing increased 3-pHis and 1-pHis signals in human HCC compared to adjacent non-tumour tissue. Similar results were observed in tumours from two additional HCC patients (total n = 4 patients). For full scans, see Supplementary Fig. 13. Tissue lysates in 2 × sample buffer (pH 8.8) heated at 95 °C for 10 min to dephosphorylate pHis served as control. The monoclonal antibodiesused to detect 3-pHis and 1-pHis are SC44–1 and SC1–1, respectively. d, Quantification of immunoblot (from c and two other western blots, n = 4 in total) indicates that 3-pHis and 1-pHis signals are significantly higher in human HCC compared to adjacent non-tumoral tissue (band intensities in each lane are normalized to the intensity of corresponding calnexin protein levels after subtracting the intensities from corresponding heated lane). The y axis represents band intensities. *P = 0.0368, **P = 0.0064, two-sided ratio paired t-test. Data are mean ± s.d. e, f, Kaplan-Meier curves, log-rank test, showing the correlation between LHPP expression and clinical outcome, as analysed for disease-free survival (e) and overall survival (f).

Comment in

References

    1. Kee J-M & Muir TW Chasing phosphohistidine, an elusive sibling in the phosphoamino acid family. ACS Chem. Biol 7, 44–51 (2012). - PMC - PubMed
    1. Fuhs SR et al. Monoclonal 1- and 3-phosphohistidine antibodies: new tools to study histidine phosphorylation. Cell 162, 198–210 (2015). - PMC - PubMed
    1. Llovet JM et al. Hepatocellular carcinoma. Nat. Rev. Dis. Primers 2, 16018–16023 (2016). - PubMed
    1. Schulze K et al. Exome sequencing of hepatocellular carcinomas identifies new mutational signatures and potential therapeutic targets. Nat. Genet 47, 505–511 (2015). - PMC - PubMed
    1. Kenerson HL et al. Akt and mTORC1 have different roles during liver tumorigenesis in mice. Gastroenterology 144, 1055–1065 (2013). - PMC - PubMed

Publication types

MeSH terms

Substances