. 2018 Mar 29;555(7698):611-616.
doi: 10.1038/nature25983. Epub 2018 Mar 21.

De novo mutations in regulatory elements in neurodevelopmental disorders

Affiliations

De novo mutations in regulatory elements in neurodevelopmental disorders

Patrick J Short et al. Nature. .

Abstract

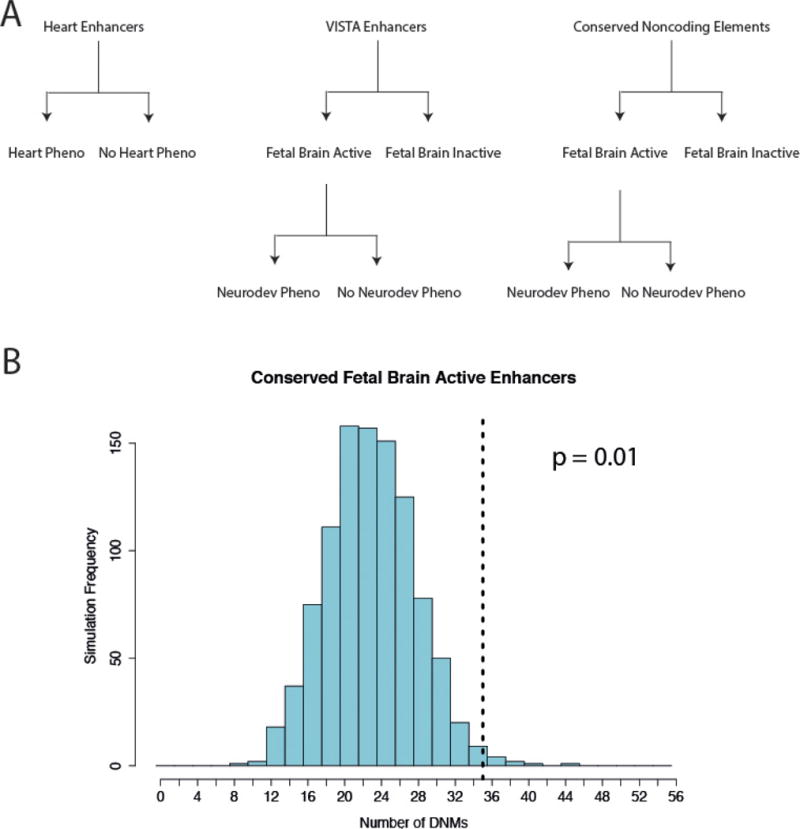
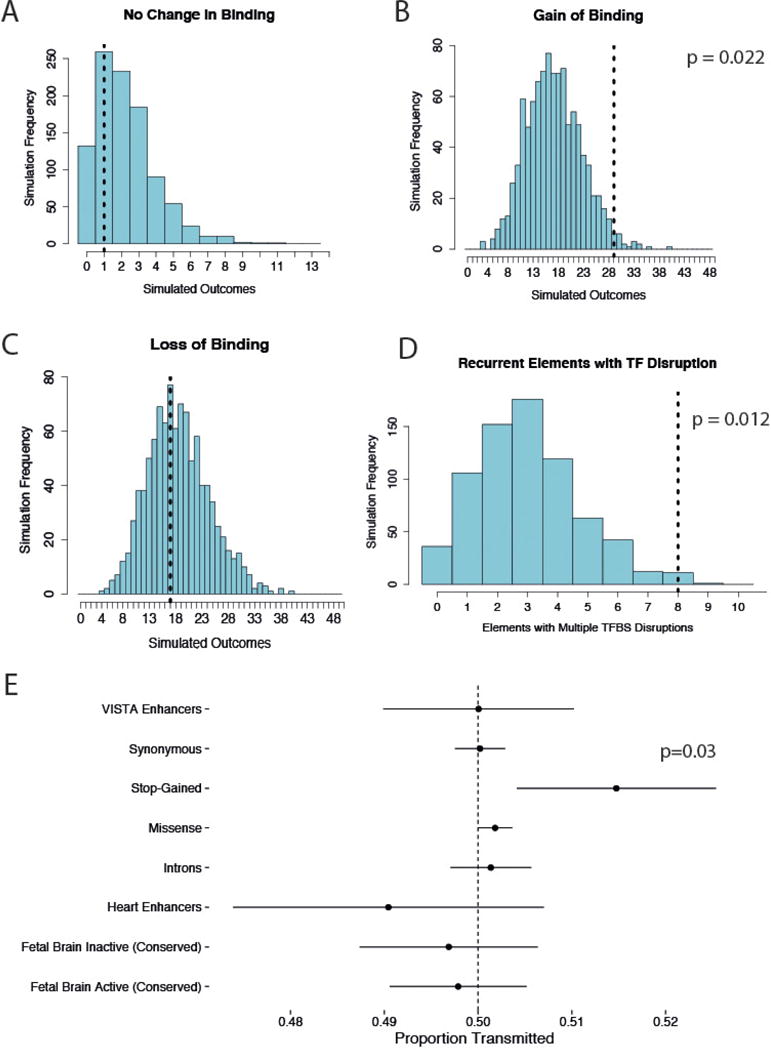
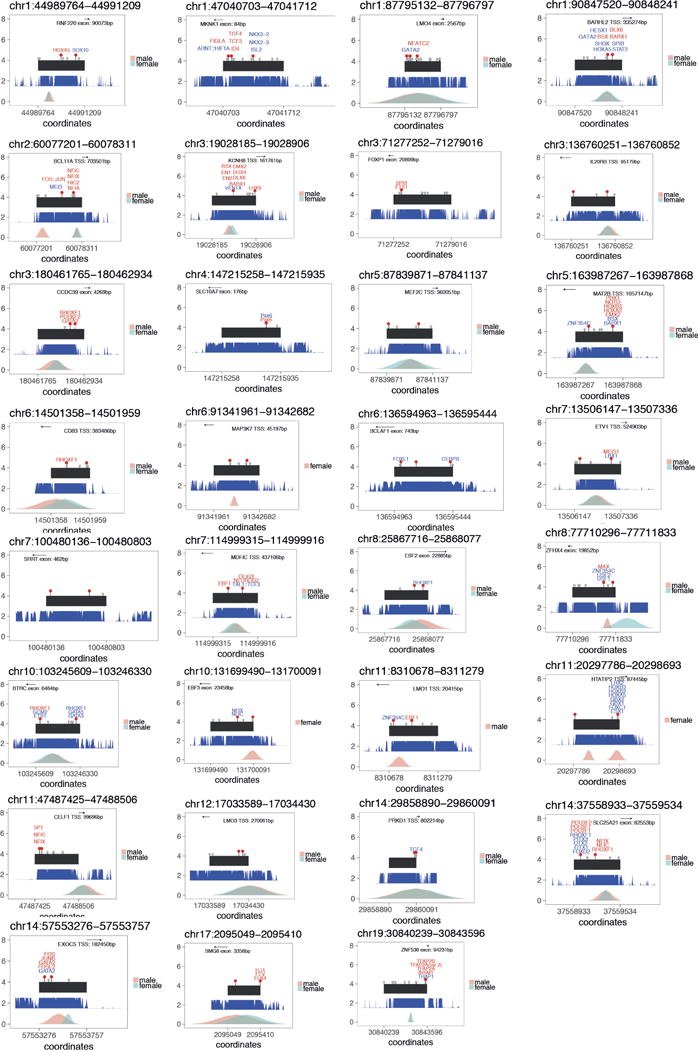
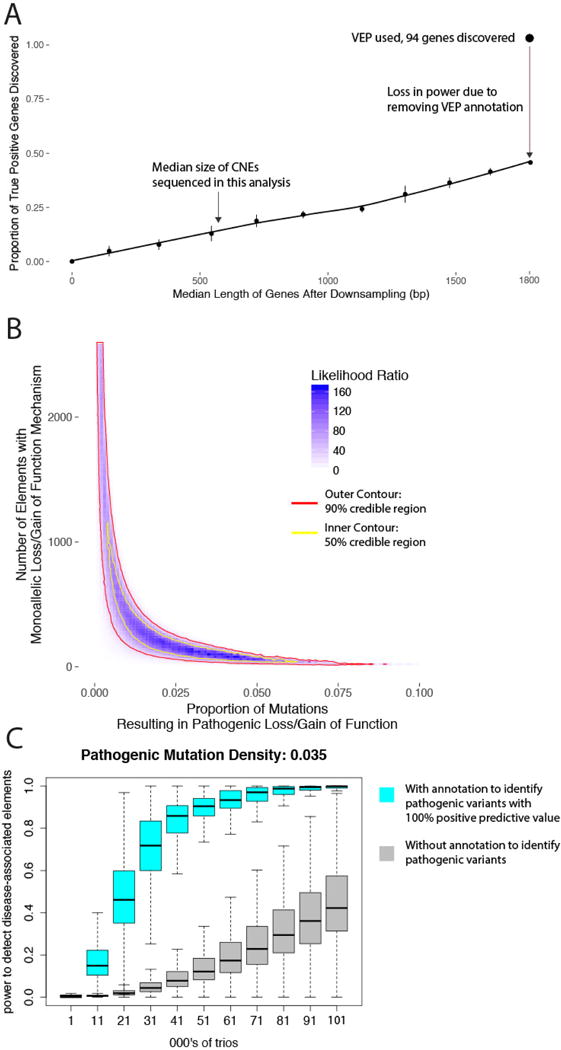
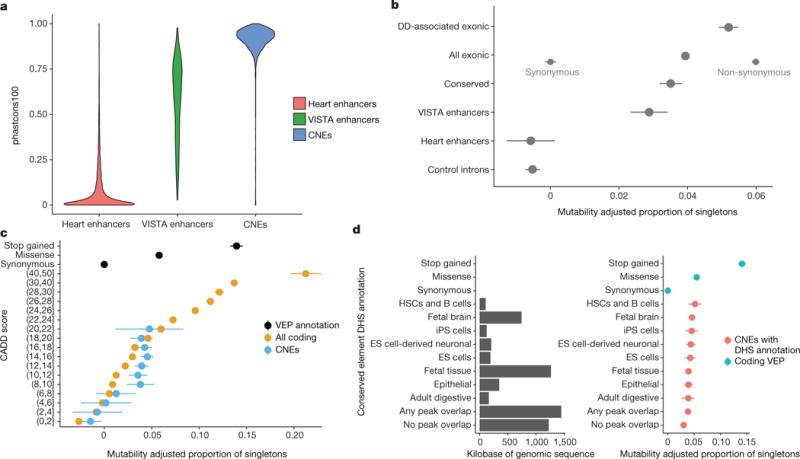
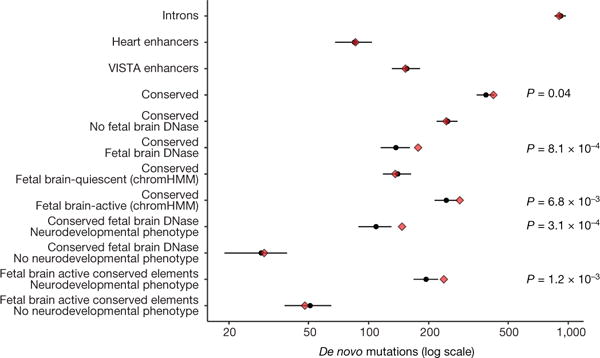
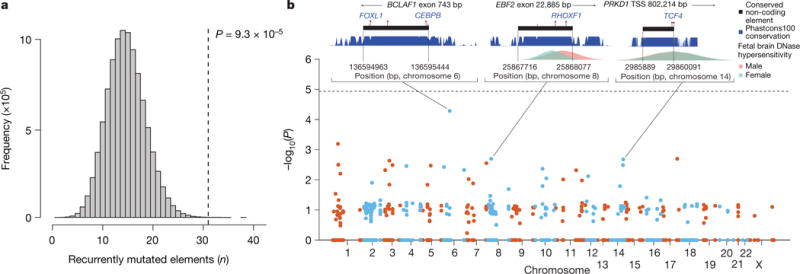
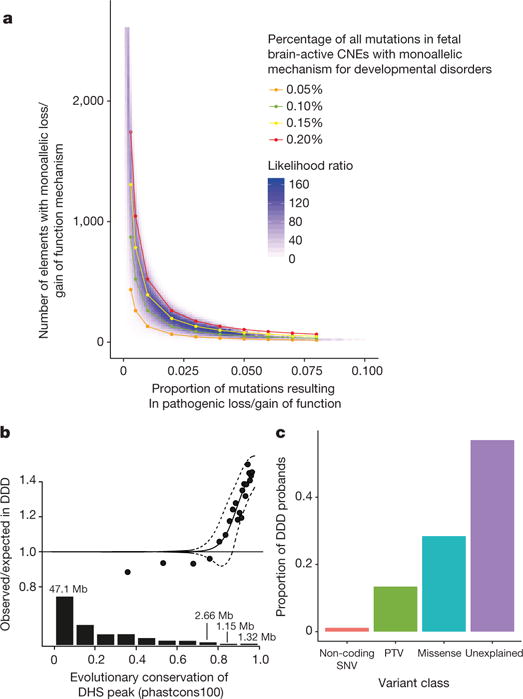
We previously estimated that 42% of patients with severe developmental disorders carry pathogenic de novo mutations in coding sequences. The role of de novo mutations in regulatory elements affecting genes associated with developmental disorders, or other genes, has been essentially unexplored. We identified de novo mutations in three classes of putative regulatory elements in almost 8,000 patients with developmental disorders. Here we show that de novo mutations in highly evolutionarily conserved fetal brain-active elements are significantly and specifically enriched in neurodevelopmental disorders. We identified a significant twofold enrichment of recurrently mutated elements. We estimate that, genome-wide, 1-3% of patients without a diagnostic coding variant carry pathogenic de novo mutations in fetal brain-active regulatory elements and that only 0.15% of all possible mutations within highly conserved fetal brain-active elements cause neurodevelopmental disorders with a dominant mechanism. Our findings represent a robust estimate of the contribution of de novo mutations in regulatory elements to this genetically heterogeneous set of disorders, and emphasize the importance of combining functional and evolutionary evidence to identify regulatory causes of genetic disorders.


Conflict of interest statement

The authors declare competing financial interests: details are available in the online version of the paper. Readers are welcome to comment on the online version of the paper.

Figures

Extended Data Figure 1
Extended Data Figure 1. Coverage in targeted non-coding elements
Coverage in the targeted non-coding elements is comparable to the proteincoding exons (median 73× and 56×, respectively).
Extended Data Figure 2
Extended Data Figure 2. Assessment of variant deleteriousness metrics and selective pressure in CNEs
Dots and bars represent the point estimate and 95% CI, respectively, for MAPS and proportion singletons. a, b, Fathmm-MKL (a) and Genomiser (b) separate benign variation (low MAPS score) from likely damaging variation (high MAPS score), but do not identify any classes of variation under strong selective constraint. c, There was no significant difference in the strength of purifying selection measured by MAPS between sites predicted to result in loss, gain, or no change in transcription factor binding. d, Validation of Fig. 1c using whole-genome data from the UK10K project. While CADD can identify coding variation under strong selective constraint (as measured by the proportion of singletons), CADD is unable to identify strongly constrained non-coding variants. e, f, The subset of CNEs sequenced in the DDD cohort that are predicted to be inactive in all 111 Roadmap Tissues (n = 261) exhibit a similar degree of evolutionary conservation (e) but lower selective constraint (f) in a healthy population compared to CNEs active in at least one tissue (n = 4,046).
Extended Data Figure 3
Extended Data Figure 3. Genomic factors that affect mutation rate in non-coding elements
a, Aggregating CpG sites genome-wide into bins of methylation proportion from 0% (unmethylated in all cells) to 100% (methylated in all cells) and calculating the observed/expected ratio reveals differences in mutability not accounted for a by a triplet model alone. b, A mutation rate model incorporating a correction for CpG methylation explains greater variance in rare variant counts in the DDD unaffected parents. c, Levels of rare variation in deep whole genomes (n = 7,509 non-Finnish Europeans) were used to estimate power to detect a hypermutability of 1.1×, 1.2×, or 1.3×. d, The level of rare variation in the fetal brain-active elements (n = 2,613, FB(+)) is slightly lower than in the fetal brain-inactive elements (n = 1694, FB(−)), consistent with similar mutability between the two element sets with slightly stronger purifying selection in the fetal brain-active elements. e, f, Elements with DNMs observed in our study are not enriched in late-replicating regions (e) or in regions with higher recombination rate (f), which have been shown to be hypermutable.
Extended Data Figure 4
Extended Data Figure 4. Non-coding mutations in exome-positive probands and poorly evolutionarily conserved sites make a minimal contribution to severe developmental disorders
a, In the 1,691 ‘exome-positive’ probands, there is no evidence for a burden of DNMs in any of the non-coding element classes tested. Red diamonds indicate the observed counts, while black circles and bars indicate the expected count and 95% CI, respectively. b, DNMs in exome-negative probands show a greater degree of evolutionary conservation (measured by PhyloP score) than DNMs in exome-positive probands in two classes: fetal brain-active CNEs (median 1.57 exome-positive, 2.85 exome-negative, n = 368 mutations) and missense changes (median 3.43 exome-positive, 3.98 exome-negative, n = 6,244 mutations).
Extended Data Figure 5
Extended Data Figure 5. Hypothesis test enumeration and enrichment for mutations in highly conserved fetal brain-active enhancers
a, We corrected for thirteen tests in order to account for the nested hypotheses based on element class and phenotype in this analysis. b, Evolutionarily conserved fetal brain-active enhancers (n = 106) are enriched for DNMs in exome-negative probands.
Extended Data Figure 6
Extended Data Figure 6. Gene target prediction for targeted noncoding elements
Pairwise concordance between four different gene target prediction methods is low. Using predicted targets from fetal brain Hi-C data, elements with an observed DNM in exome-negative probands (n = 286) do not show any bias towards any of the gene sets consistently implicated in neurodevelopmental disorders. Dots and bars represent the point estimate and 95% confidence interval, respectively.
Extended Data Figure 7
Extended Data Figure 7. Transcription factor binding disruption and transmission disequilibrium test
a–d, Comparison of predicted change in transcription factor binding for observed DNMs compared to null mutation model. Empirical P values derived from comparison with mutations simulated from the null mutation model. e, None of the non-coding element classes tested show any evidence of overtransmission from parents to affected children. Dots and bars represent the point estimate and 95% confidence intervals of estimates of transmission proportions, respectively.
Extended Data Figure 8
Extended Data Figure 8. Predicted chromatin state for recurrently mutated elements
chromHMM state of the n = 31 recurrently mutated elements shows enrichment for enhancers and transcribed elements. Elements that overlapped a high confidence DHS but were predicted as quiescent by chromHMM are classed as Overlaps DHS. P values derived from Poisson distribution with parameter lambda defined by the simulated data.
Extended Data Figure 9
Extended Data Figure 9. Schematic describing each of the thirty-one recurrently mutated elements
Element is in black, red lollipops denote observed DNMs, grey lollipops denote observed variation at MAF >0.1% in 7,080 unaffected parents, phastcons100 conservation score is shown in blue, and DHSs from the Roadmap Epigenome project are shown in blue/pink in the bottom track.
Extended Data Figure 10
Extended Data Figure 10. Empirical and simulated power for disease association in targeted non-coding elements
a, Estimation of the reduction in power due to size differences between non-coding elements and genes (median 600 bp versus 1,800 bp) and ignoring VEP annotations used to stratify benign from likely damaging variants. Dots and bars represent the point estimate and 95% confidence interval, respectively. b, Credible intervals for the proportion of fetal brain-active conserved elements and proportion of sites within those elements with a dominant mechanism for developmental disorders. c, Power calculations for disease-associated non-coding element discovery. Without annotation or tools to discriminate pathogenic from benign variants in non-coding elements (grey), more than 100,000 trios are required to achieve 40% power. With annotation or tools to fully discriminate likely pathogenic from benign variants (blue), 40% power is achieved with only 21,000 trios.
Figure 1
Figure 1. Selective constraint in targeted non-coding elements
a, Evolutionary conservation score (phastcons10019) for CNEs (n = 4,307), experimentally validated enhancers (VISTA; n = 595), and putative heart enhancers (n = 1,237). b, Strength of selection (MAPS metric, mean and 95% CI represented by dot and bars) in targeted noncoding elements compared to protein-coding regions, where ‘Exonic’ refers to all variation within protein coding-exons. Stratification based on synonymous/non-synonymous consequence displayed on the same row to illustrate power of even a simple discriminator. Introns and putative heart enhancers show little evidence of purifying selection while CNEs show selection on par with all genes, but less than genes known to be associated with developmental disorders. c, Using CADD to stratify coding and non-coding variants observed in unaffected parents differentiates neutral variation from weakly and strongly constrained sites in coding regions, but fails to identify non-coding variation with selection pressure on par with protein-truncating variants (stop gained). d, Sites overlapping a DHS in at least one tissue are under stronger purifying selection than sites not overlapping a DHS. ES cells, embryonic stem cells; HSCs, haematopoietic stem cells; iPS cells, induced pluripotent stem cells.
Figure 2
Figure 2. Enrichment of DNMs across element classes and functional annotations in exome-negative probands
n = 6,239. Red diamonds indicate observed counts, while black circles and bars indicate expected count and 95% CI, respectively. Targeted CNEs showed a modest enrichment for DNMs (422 observed, 388 expected, P = 0.04) while heart enhancers, experimentally validated enhancers, and control introns matched the null model. Observed enrichment is specific to CNEs predicted to be active in the fetal brain and to patients with neurodevelopmental disorders (238 observed, 194 expected, P = 1.2 × 10⁻³). Confidence intervals and P values derived from a Poisson distribution.
Figure 3
Figure 3. Recurrently mutated elements
a, Approximately twofold enrichment of recurrently mutated non-coding elements. Grey histogram shows distribution of expected number of recurrently mutated fetal brain-active non-coding elements under the null model and vertical line indicates observed number. b, Enrichment test of individual non-coding elements. No element was significant at a genome-wide threshold of P <1.9 × 10⁻⁵ (Bonferroni correction for testing 2,613 fetal brain-active elements). Inset plots for three elements show the nearest exon or transcription start site, location of DNMs (red markers) with any predicted transcription factor binding site disruptions (gain of binding in blue, loss of binding in red), location of rare variants in unaffected parents (grey markers), evolutionary conservation (blue, higher indicates more conserved), and fetal brain DNase I hypersensitivity (male in pink, female in blue). TSS, transcription start site.
Figure 4
Figure 4. Modelling the proportion of DNMs in non-coding elements that are likely to be highly penetrant for dominant neurodevelopmental disorders
a, Our observation of zero non-coding elements at genomewide significance in 6,239 exome-negative probands indicates that very few sites within these elements (<5%) are likely to contribute to developmental disorders through a highly penetrant dominant mechanism. b, Logistic regression used to model the genome-wide contribution of dominant-acting DNMs in fetal brain DNase hypersensitive sites in non-coding elements as a function of level of evolutionary conservation using a sliding window approach including 1,000 elements in each bin (see Methods). Dashed lines indicate the upper and lower 95% CI. The bar plot shows fetal brain-active DHS peaks genome-wide (in megabase of total sequence) at a given level of evolutionary conservation. c, The proportion of probands carrying a pathogenic de novo SNV in a fetal brain-active regulatory element (1-2.8%) is far lower than the proportion carrying a pathogenic protein-truncating DNM (~13.4%) or missense DNM (~28.4%).

References

    1. Hindorff LA, et al. Potential etiologic and functional implications of genome-wide association loci for human diseases and traits. Proc Natl Acad Sci USA. 2009;106:9362–9367. - PMC - PubMed
    1. Maurano MT, et al. Systematic localization of common disease-associated variation in regulatory DNA. Science. 2012;337:1190–1195. - PMC - PubMed
    1. Mathelier A, Shi W, Wasserman WW. Identification of altered cis-regulatory elements in human disease. Trends Genet. 2015;31:67–76. - PubMed
    1. Spielmann M, Mundlos S. Looking beyond the genes: the role of non-coding variants in human disease. Human Mol Genet. 2016;25:157–165. - PubMed
    1. Zhang F, Lupski JR. Non-coding genetic variants in human disease. Hum Mol Genet. 2015;24:R102–R110. - PMC - PubMed

Publication types