

Dynamic Causal Modeling of Preclinical Autosomal-Dominant Alzheimer's Disease
- PMID: 29562504
- PMCID: PMC6923812
- DOI: 10.3233/JAD-170405
Dynamic Causal Modeling of Preclinical Autosomal-Dominant Alzheimer's Disease
Abstract
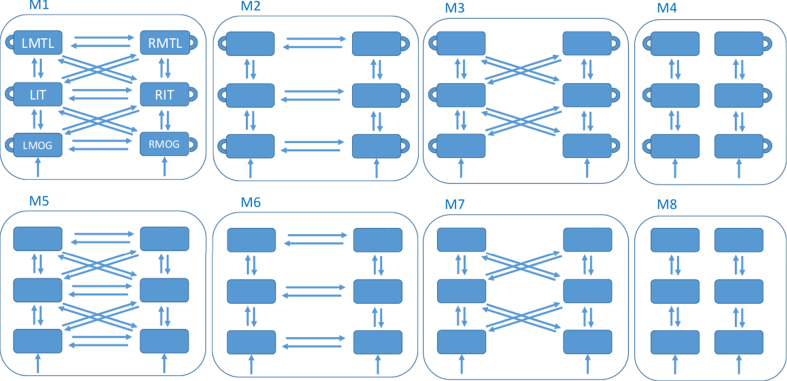
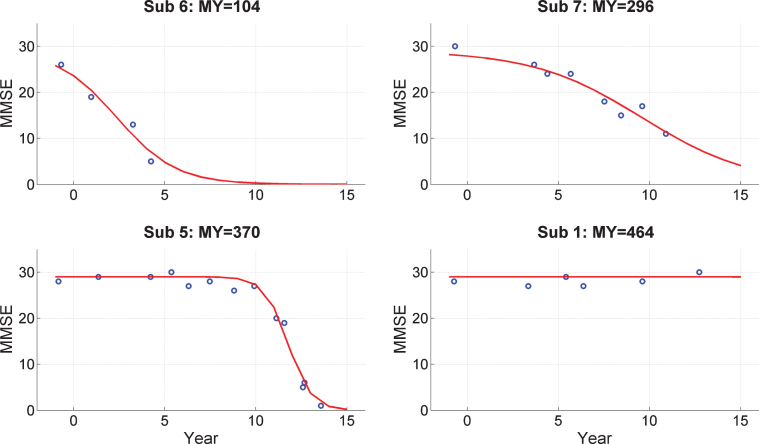
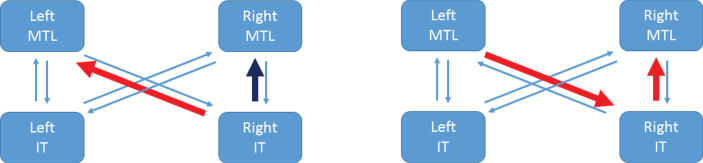
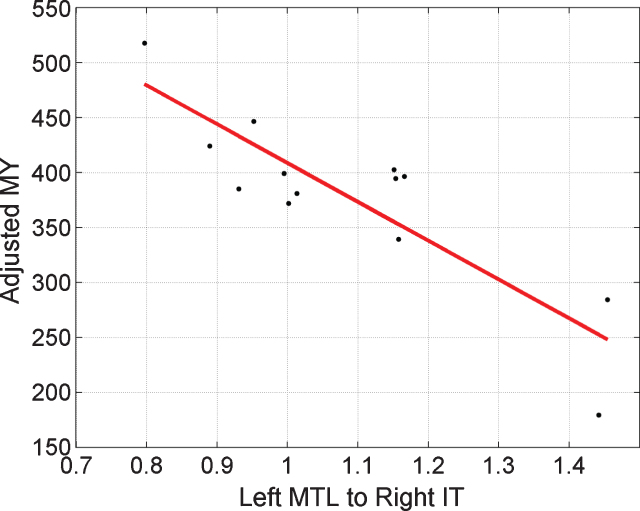
Dynamic causal modeling (DCM) is a framework for making inferences about changes in brain connectivity using neuroimaging data. We fitted DCMs to high-density EEG data from subjects performing a semantic picture matching task. The subjects are carriers of the PSEN1 mutation, which leads to early onset Alzheimer's disease, but at the time of EEG acquisition in 1999, these subjects were cognitively unimpaired. We asked 1) what is the optimal model architecture for explaining the event-related potentials in this population, 2) which connections are different between this Presymptomatic Carrier (PreC) group and a Non-Carrier (NonC) group performing the same task, and 3) which network connections are predictive of subsequent Mini-Mental State Exam (MMSE) trajectories. We found 1) a model with hierarchical rather than lateral connections between hemispheres to be optimal, 2) that a pathway from right inferotemporal cortex (IT) to left medial temporal lobe (MTL) was preferentially activated by incongruent items for subjects in the PreC group but not the NonC group, and 3) that increased effective connectivity among left MTL, right IT, and right MTL was predictive of subsequent MMSE scores.
Keywords: Autosomal dominant; EEG; dynamic causal modeling; effective connectivity; multivariate.
Figures
Similar articles
-
The Alzheimer's prevention initiative composite cognitive test score: sample size estimates for the evaluation of preclinical Alzheimer's disease treatments in presenilin 1 E280A mutation carriers.J Clin Psychiatry. 2014 Jun;75(6):652-60. doi: 10.4088/JCP.13m08927. J Clin Psychiatry. 2014. PMID: 24816373 Free PMC article. Review.
-
Functional Connectivity of Default Mode Network Subsystems in the Presymptomatic Stage of Autosomal Dominant Alzheimer's Disease.J Alzheimers Dis. 2020;73(4):1435-1444. doi: 10.3233/JAD-191065. J Alzheimers Dis. 2020. PMID: 31929167
-
ERP generator anomalies in presymptomatic carriers of the Alzheimer's disease E280A PS-1 mutation.Hum Brain Mapp. 2010 Feb;31(2):247-65. doi: 10.1002/hbm.20861. Hum Brain Mapp. 2010. PMID: 19650138 Free PMC article.
-
Successful Object Encoding Induces Increased Directed Connectivity in Presymptomatic Early-Onset Alzheimer's Disease.J Alzheimers Dis. 2017;55(3):1195-1205. doi: 10.3233/JAD-160803. J Alzheimers Dis. 2017. PMID: 27792014 Free PMC article.
-
Biological and Cognitive Markers of Presenilin1 E280A Autosomal Dominant Alzheimer's Disease: A Comprehensive Review of the Colombian Kindred.J Prev Alzheimers Dis. 2019;6(2):112-120. doi: 10.14283/jpad.2019.6. J Prev Alzheimers Dis. 2019. PMID: 30756118 Free PMC article. Review.
Cited by
-
A survey of brain network analysis by electroencephalographic signals.Cogn Neurodyn. 2022 Feb;16(1):17-41. doi: 10.1007/s11571-021-09689-8. Epub 2021 Jun 14. Cogn Neurodyn. 2022. PMID: 35126769 Free PMC article.
-
Computational Causal Modeling of the Dynamic Biomarker Cascade in Alzheimer's Disease.Comput Math Methods Med. 2019 Feb 3;2019:6216530. doi: 10.1155/2019/6216530. eCollection 2019. Comput Math Methods Med. 2019. PMID: 30863455 Free PMC article.
-
A guide to group effective connectivity analysis, part 2: Second level analysis with PEB.Neuroimage. 2019 Oct 15;200:12-25. doi: 10.1016/j.neuroimage.2019.06.032. Epub 2019 Jun 18. Neuroimage. 2019. PMID: 31226492 Free PMC article.
-
Shaping a data-driven era in dementia care pathway through computational neurology approaches.BMC Med. 2020 Dec 16;18(1):398. doi: 10.1186/s12916-020-01841-1. BMC Med. 2020. PMID: 33323116 Free PMC article. Review.
-
A Triple-Network Dynamic Connection Study in Alzheimer's Disease.Front Psychiatry. 2022 Apr 4;13:862958. doi: 10.3389/fpsyt.2022.862958. eCollection 2022. Front Psychiatry. 2022. PMID: 35444581 Free PMC article.
References
-
- Bateman RJ, Xiong C, Benzinger TL, Fagan AM, Goate A, Fox NC, Marcus DS, Cairns NJ, Xie X, Blazey TM, Holtzman DM, Santacruz A, Buckles V, Oliver A, Moulder K, Aisen PS, Ghetti B, Klunk WE, McDade E, Martins RN, Masters CL, Mayeux R, Ringman JM, Rossor MN, Schofield PR, Sperling RA, Salloway S, Morris JC, Dominantly Inherited Alzheimer Network (2012) Clinical and biomarker changes in dominantly inherited Alzheimer’s disease. New Engl J Med 367, 795–804. - PMC - PubMed
-
- Ryan N, Fox N (2014) Imaging presymptomatic Alzheimer’s disease. Adv Clin Neurosci Rehabil 14, 6–9.
-
- Acosta-Buena N, Sepulveda-Falla D, Lopera-Gomez C, Jaramillo-Elorza M, Moreno S, Aguirre-Acevedo D, Saldarriaga A, Lopera F (2011) Pre-dementia clinical stages in Presenilin 1 E280A familial early-onset Alzheimer’s disease: A retrospective cohort study. Lancet 10, 213–220. - PubMed
-
- Maestu F, Pena J, Garces P, Gonzalez S, Bajo R, Bagic A, Cuesta P, Funke M, Makela J, Menasalvas E, Nakamura A, Parkonnen L, Lopez M, del Pozo F, Sudre G, Zamrini E, Pekkonen E, Henson R, Becker J, MEG International Consortium of Alzheimer’s Disease (2015) A multicentre study of the early detection of synaptic dysfunction in mild cognitive impairment using MEG-derived functional connectivity. Neuroimage Clin 9, 103–109. - PMC - PubMed
Publication types
MeSH terms
Substances
Grants and funding
LinkOut - more resources
Full Text Sources
Other Literature Sources
Medical
