. 2018 Mar 17;11(3):440.
doi: 10.3390/ma11030440.

Optical Aggregation of Gold Nanoparticles for SERS Detection of Proteins and Toxins in Liquid Environment: Towards Ultrasensitive and Selective Detection

Affiliations

Optical Aggregation of Gold Nanoparticles for SERS Detection of Proteins and Toxins in Liquid Environment: Towards Ultrasensitive and Selective Detection

Antonino Foti et al. Materials (Basel). .

Abstract

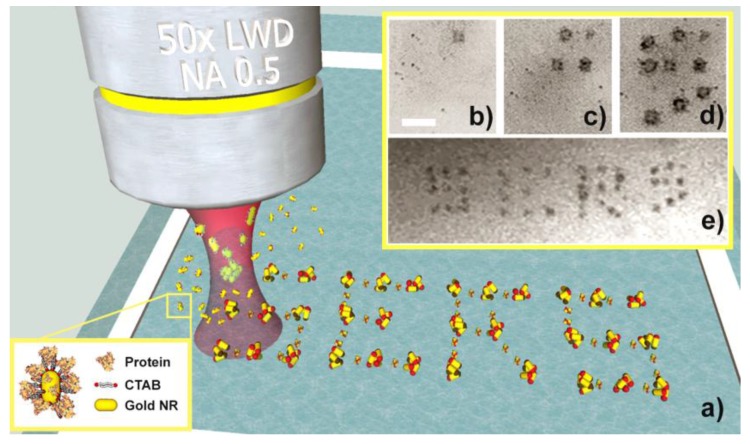
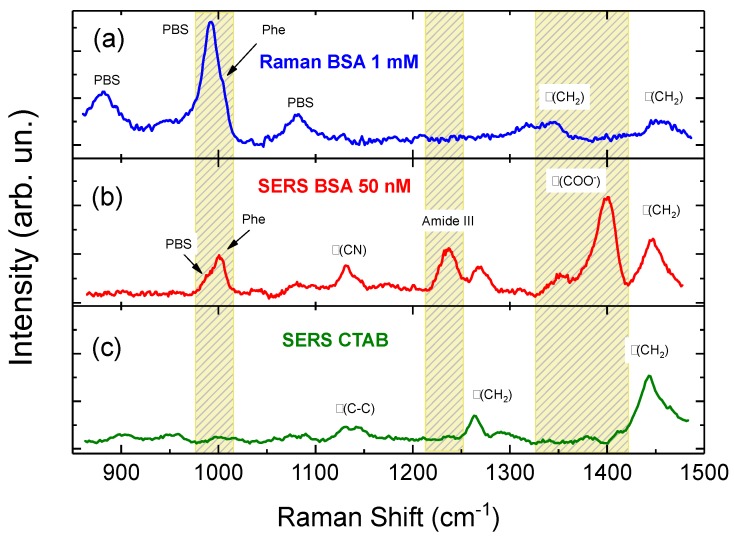
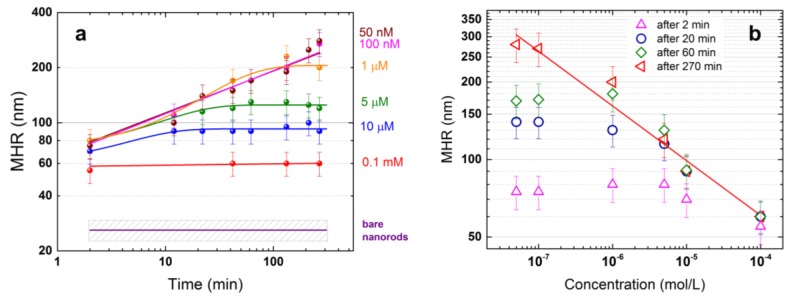
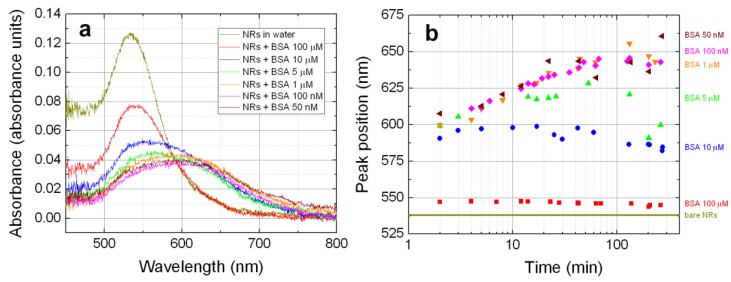
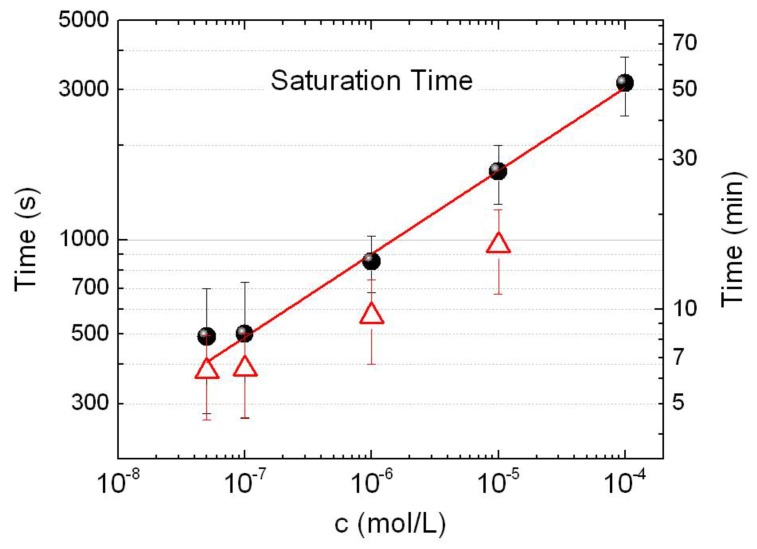
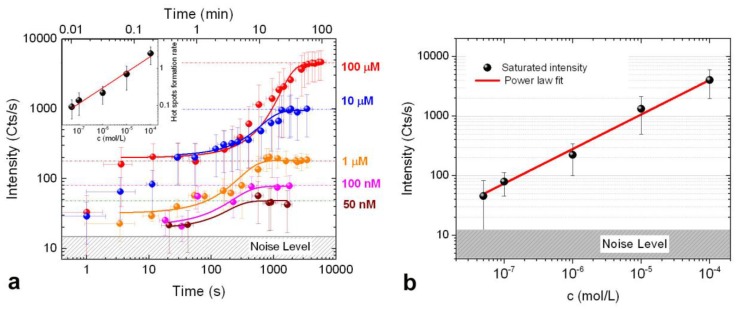
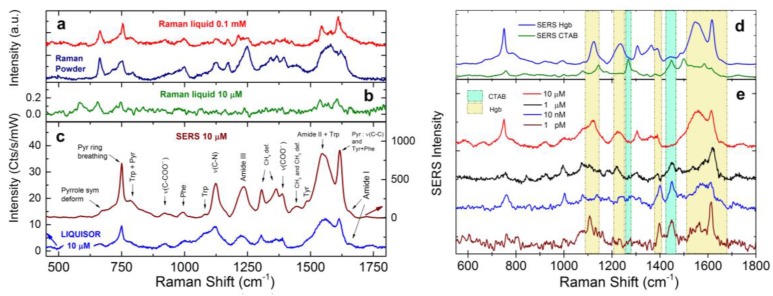
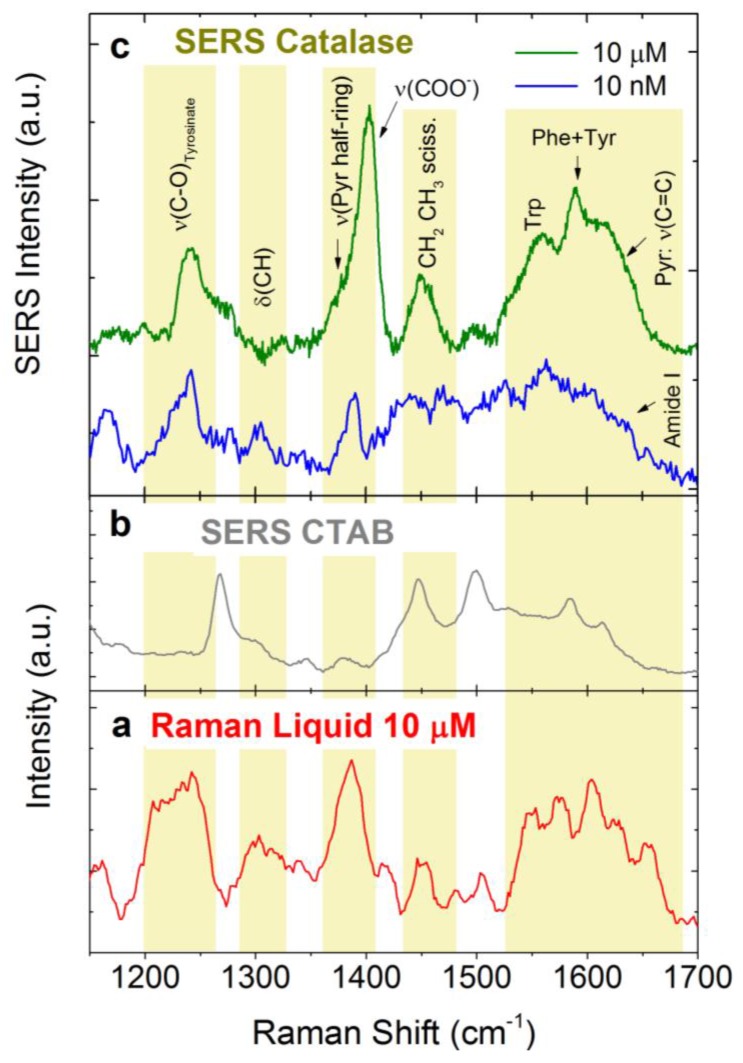
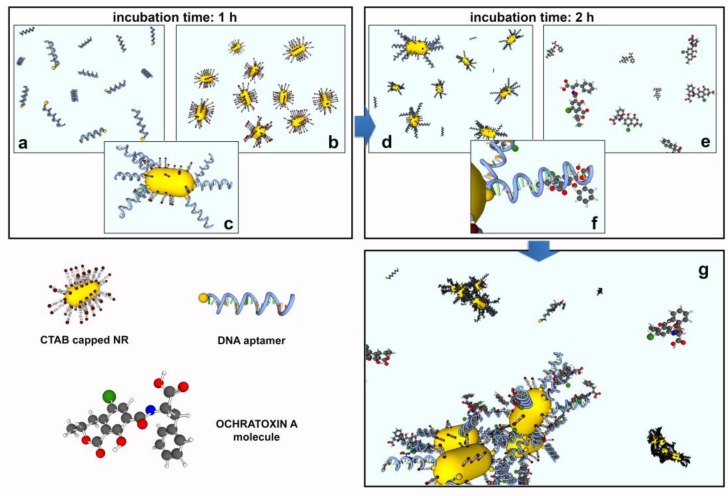
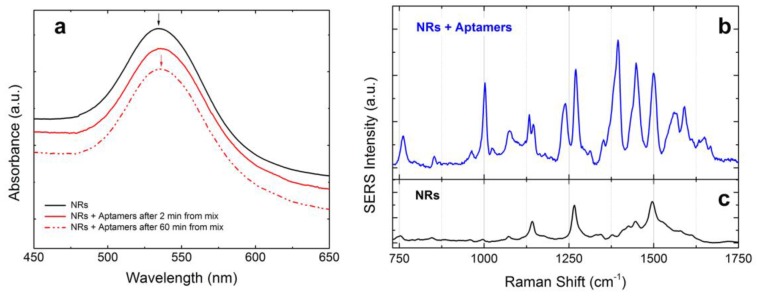
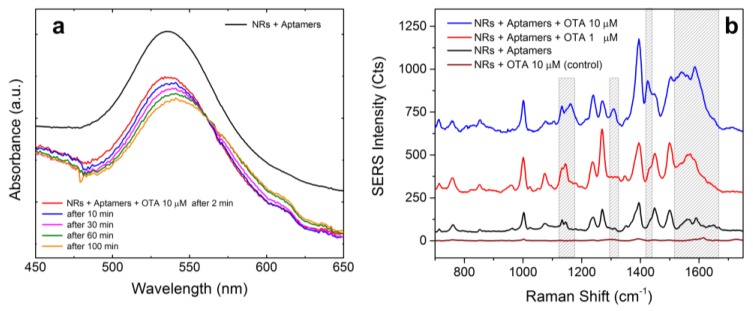
Optical forces are used to aggregate plasmonic nanoparticles and create SERS-active hot spots in liquid. When biomolecules are added to the nanoparticles, high sensitivity SERS detection can be accomplished. Here, we pursue studies on Bovine Serum Albumin (BSA) detection, investigating the BSA-nanorod aggregations in a range from 100 µM to 50 nM by combining light scattering, plasmon resonance and SERS, and correlating the SERS signal with the concentration. Experimental data are fitted with a simple model describing the optical aggregation process. We show that BSA-nanorod complexes can be optically printed on non-functionalized glass surfaces, designing custom patterns stable with time. Furthermore, we demonstrate that this methodology can be used to detect catalase and hemoglobin, two Raman resonant biomolecules, at concentrations of 10 nM and 1 pM, respectively, i.e., well beyond the limit of detection of BSA. Finally, we show that nanorods functionalized with specific aptamers can be used to capture and detect Ochratoxin A, a fungal toxin found in food commodities and wine. This experiment represents the first step towards the addition of molecular specificity to this novel biosensor strategy.

Keywords: SERS; aptamers; biosensor; colloids; gold nanoparticles; hemeprotein; optical forces; optical patterning; optical tweezers; toxins.


Conflict of interest statement

The authors declare no conflict of interest.

Figures

Figure 1
Figure 1
(a) Sketch of the LIQUISOR methodology in which a focused laser beam is used to optically aggregate BIO-NRC complexes (inset) dispersed in solution. (bd) Optical pictures of BIO-NRC aggregates produced sequentially to print the word “SERS” (e) in liquid. Scale bar in (e) is 15 µm. Optical printing of each spot requires ca. 3 min.
Figure 2
Figure 2
(a) Raman spectrum of BSA 1 mM in PB (laser power 6.5 mW, integration 30 s). (b) SERS spectrum of BSA 50 nM in PB (laser power 6.5 mW, integration 30 s). (c) SERS signal detected on NRs precipitated in absence of protein, attributed to the residual CTAB (laser power 2 mW, integration 120 s).
Figure 3
Figure 3
(a) Mean hydrodynamic radius (MHR) of BIO-NRCs as a function of time at BSA concentrations of 0.1 mM (red dots), 10 µM (blue dots), 5 µM (green dots), 1 µM (orange dots), 100 nM (pink dots) and 50 nM (brown dots). The solid colored lines are fits of the experimental data using a model r(t)=r0+A(1et/t0). Best fit parameters are: r0 = 70 ± 20 nm, A = 140 ± 20 nm, t0 = 45 ± 20 min (orange line, 1 µM); r0 = 72 ± 7 nm, A = 53 ± 7 nm, t0 = 11 ± 3 min (green line, 5 µM); r0 = 60 ± 10 nm, A = 35 ± 10 nm, t0 = 5 ± 3 min (blue line, 10 µM). The purple line represents the MHR measured on the CTAB-coated pristine NRs. Data at 100 nM and 50 nM are fitted with a power law r(t)~tb with b=0.23±0.01 for both concentrations (pink and brown lines). (b) MHR as a function of protein concentration after 2 min (pink triangles), 20 min (blue circles), 60 min (green diamonds) and 270 min (red triangles) from the mixing. (red line) Power law fit of the data. Best fit exponent −0.21 ± 0.02.
Figure 4
Figure 4
(a) Plasmon resonance of the CTAB-coated NRs diluted in water (gold line) and after few minutes from mixing with BSA in PB at different concentrations (other colored lines). (b) Position of the red-shifted component of the plasmon resonance of the BSA-NR complexes as a function of time for different BSA concentrations. In all fits, the position of the 540 nm peak (not shown) is constant within ±3%.
Figure 5
Figure 5
Saturation time (black dots) plotted against BSA concentration. Each point is the average of the saturation times for at least three different aggregates. Red line is power law fit with exponent 0.26 ± 0.01 (best fit parameter). Red symbols are estimated values for Tsat from the hydrodynamic model in Supplementary Note 1.
Figure 6
Figure 6
(a) Time evolution of the SERS intensity at different BSA concentrations (colored dots). The time T0 = 0 is set at the onset of the process, when the first weak SERS signal is detected (real-time observation). Starting from T0 the signal is recorded at intervals corresponding to the integration time used in each spectrum. Solid lines are fits of data using a Boltzmann growth kinetics equation. (inset) Plot of the maximum signal growth rate vs BSA concentration. The solid red line is a power law fit with an exponent 0.40 ± 0.04 as best fit parameter. (b) Plot of the SERS intensity at saturation vs. BSA concentration (symbols). The red line is a power law fit with exponent 0.60 ± 0.04.
Figure 7
Figure 7
(a) Raman spectra of Hgb 0.1 mM in PB (red line—P = 18 mW, T = 60 s, two accumulations) and in powder state (blue line—P = 0.27 mW, T = 60 s, five accumulations); (b) Raman spectrum of Hgb 10 µM in PB (P = 18 mW, T = 240 s, two accumulations); (c) SERS spectra of Hgb 10 µM acquired with the LIQUISOR methodology (blue line, P = 6.5 mW, T = 1 s) and on a spontaneous aggregate formed after 24 h incubation (brown line—P = 3 mW, T = 1 s); (d) reference SERS spectra from aggregates for Hgb (blue line) and CTAB (green line—P = 6.5 mW, T = 1 s, 120 accumulations); and (e) SERS spectra of Hgb at decreasing concentrations (P = 6.5 mW, T = 1 s, 50 accumulations). Yellow boxes highlight SERS bands due to the protein while green boxes are due to the CTAB SERS peaks.
Figure 8
Figure 8
(a) Raman spectrum in liquid of Catalase diluted at 10 µM in PB 10 mM (P = 18 mW, T = 240 s, five accumulations); (b) SERS spectrum of CTAB (grey line—P = 6.5 mW, T = 1 s, 120 accumulations); and (c) SERS spectrum of Catalase acquired with the LIQUISOR methodology at 10 µM (green line, T =1 s P = 3.5 mW, 30 accumulations) and 10 nM (blue line, T =1 s P = 6.5 mW, 30 accumulations). Yellow boxes highlight the vibrational modes due to the protein.
Figure 9
Figure 9
Functionalization process: (a) ssDNA aptamer solution is mixed with (b) gold NRs in the volume proportion 1:3. After the system has incubated for 1 h, the aptamer functionalized NRs (c,d) are mixed with the OTA molecules (e) in the volume proportion 3:1. The system is left to incubate for about 2 h to allow the interaction between DNA aptamers and molecules (f) for the formation of the NR complexes (g).
Figure 10
Figure 10
(a) Extinction spectra of the CTAB-coated gold NRs (black line) compared to ones functionalized with the aptamers after 2 min of incubation (red solid line) and after 60 min of incubation (red dashed line). The functionalization induces a red-shift of 2 nm that does not change with time. Spectra are offset for clarity. (b) SERS signal from the NRs + aptamer complexes optically aggregated at the bottom of the glass microcell (P = 5 mW, T = 1 s). The signal results averaged over 100 consecutive spectra. (c) SERS signal (reference) acquired from the CTAB-coated NRs precipitated at the bottom of the glass microcell (P = 1.8 mW, T =1 s) in absence of aptamers.
Figure 11
Figure 11
(a) Extinction spectra of aptamers-functionalized NRs after 60 min (black line). Addition of OTA (10 µM) causes a progressive shift and broadening of the NRs LSPR (colored lines), due to the interaction between aptamers and OTA molecules. (b) LIQUISOR SERS spectrum of aptamers for OTA (black line—P = 5 mW, T = 1 s) compared with the SERS spectrum observed from induced aggregates formed by functionalized NRs mixed with OTA 10 µM (blue line—P = 5 mW, T = 1 s) and 1 µM (red line—P = 5 mW, T = 1 s). Brown line is the spectrum coming out from aggregates spontaneously deposited on the bottom of the glass microcell after mixing NRs and OTA 10 µM without DNA aptamers (P = 18 mW, T = 1 s—in the figure, the spectrum is normalized to P = 5 mW for a better comparison with the other spectra). Dashed boxes highlight the spectral regions where the most evident differences can be observed. All the SERS spectra are averaged over at least 100 consecutive spectra. Data are offset for clarity.

Similar articles

Cited by

References

    1. Le Ru E., Etchegoin P.G. Principles of Surface Enhanced Raman Spectroscopy. Elsevier; Amsterdam, The Netherlands: 2009.
    1. Schluecker S. Surface-Enhanced Raman Spectroscopy: Concepts and Chemical Applications. Angew. Chem. Int. Ed. 2014;53:4756–4795. doi: 10.1002/anie.201205748. - DOI - PubMed
    1. Han X.X., Huang G.G., Zhao B., Ozaki Y. Label-free highly sensitive detection of proteins in aqueous solutions using surface-enhanced Raman scattering. Anal. Chem. 2009;81:3329–3333. doi: 10.1021/ac900395x. - DOI - PubMed
    1. Yang X., Gu C., Qian F., Li Y., Zhang Y.L., Gu C., Qian F., Li Y., Zhang Y.L. Highly sensitive detection of proteins and bacteria in aqueous solution using surface-enhanced Raman scattering and optical fibers. Anal. Chem. 2011;83:5888–5894. doi: 10.1021/ac200707t. - DOI - PubMed
    1. Schluecker S. SERS Microscopy: Nanoparticle Probes and Biomedical Applications. Chemphyschem. 2009;10:1344–1354. doi: 10.1002/cphc.200900119. - DOI - PubMed

LinkOut - more resources