Randomized Controlled Trial
. 2018 Mar 17;10(3):369.
doi: 10.3390/nu10030369.

Comprehensive Nutritional and Dietary Intervention for Autism Spectrum Disorder-A Randomized, Controlled 12-Month Trial

Affiliations
Randomized Controlled Trial

Comprehensive Nutritional and Dietary Intervention for Autism Spectrum Disorder-A Randomized, Controlled 12-Month Trial

James B Adams et al. Nutrients. .

Abstract

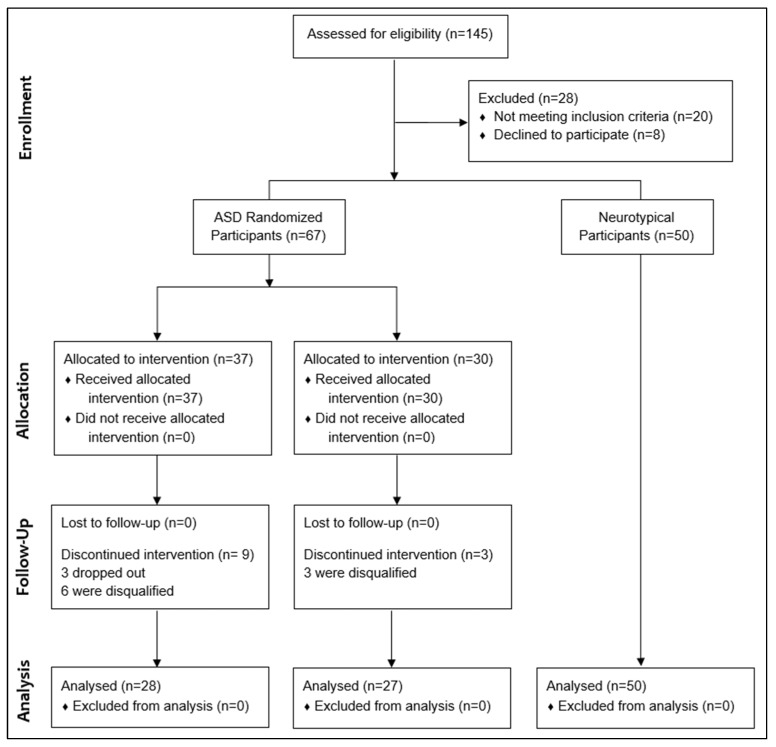
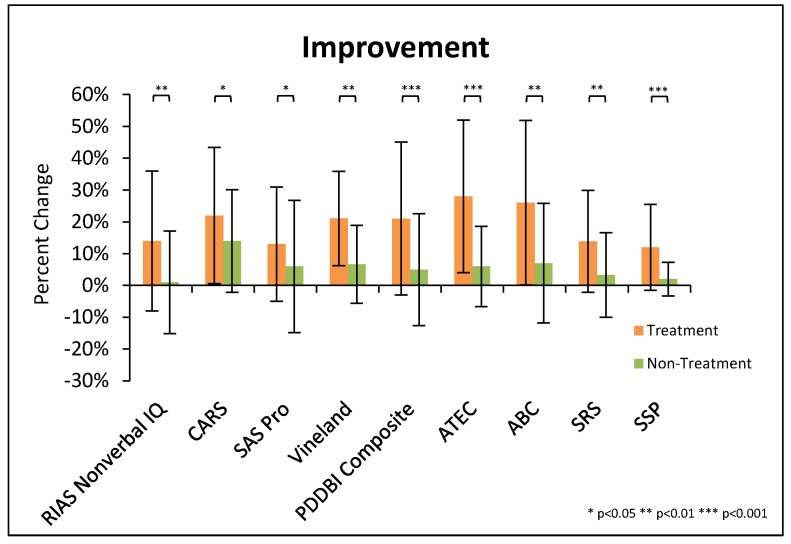
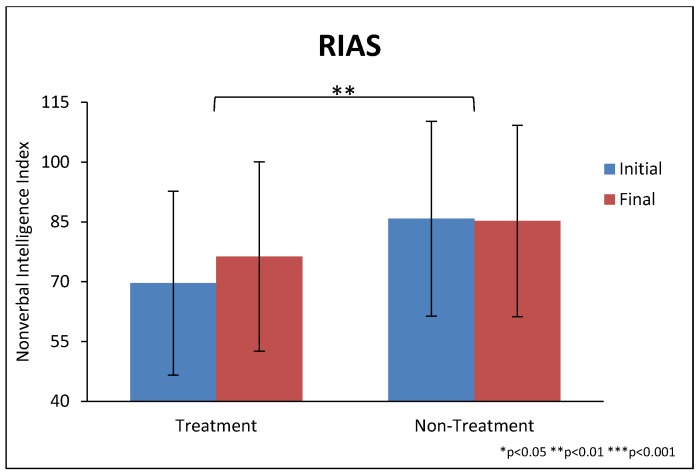
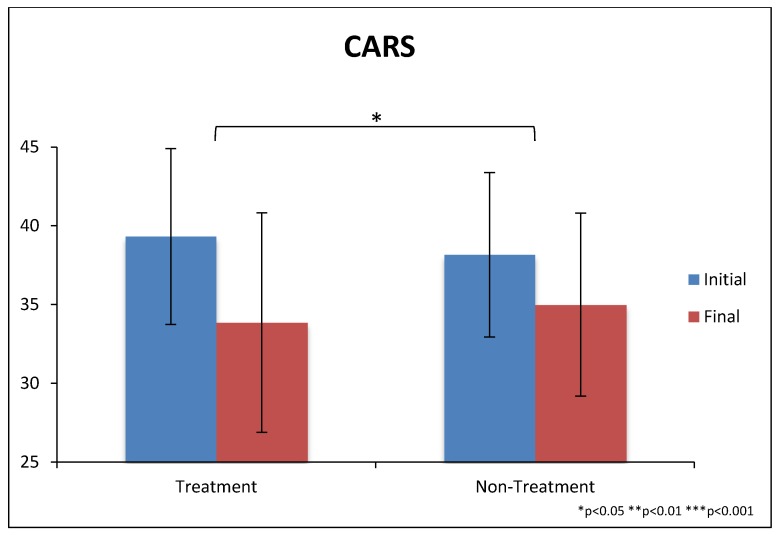
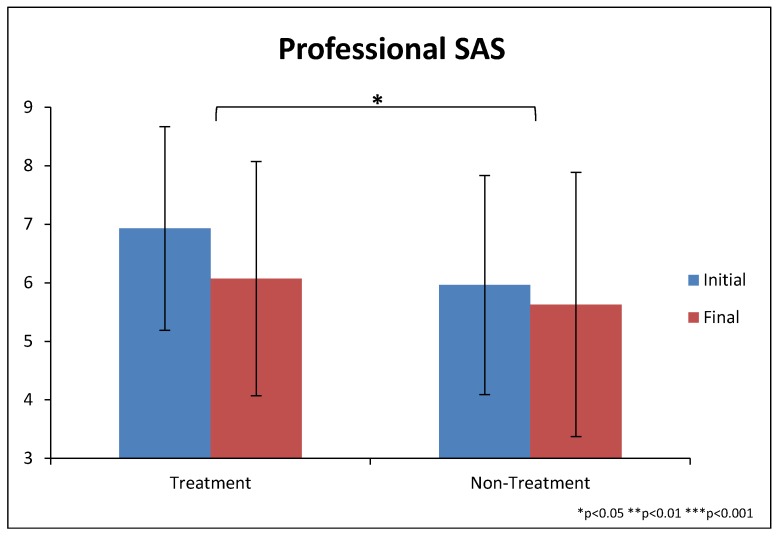
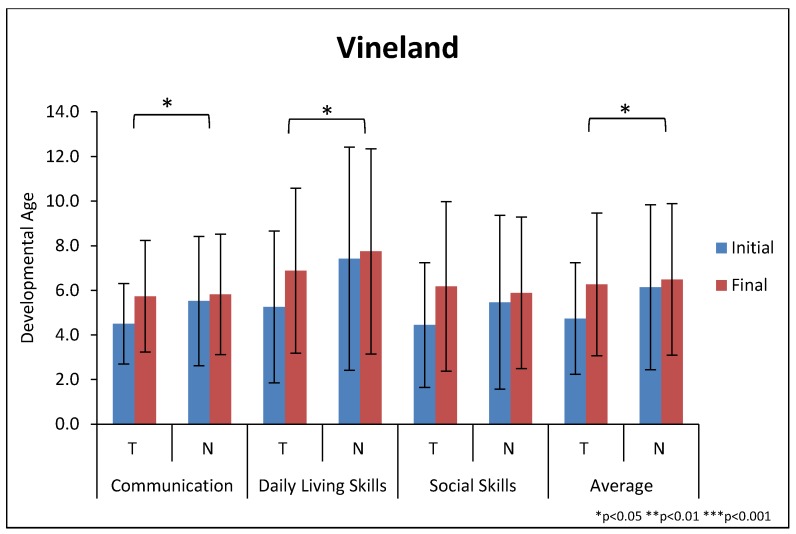
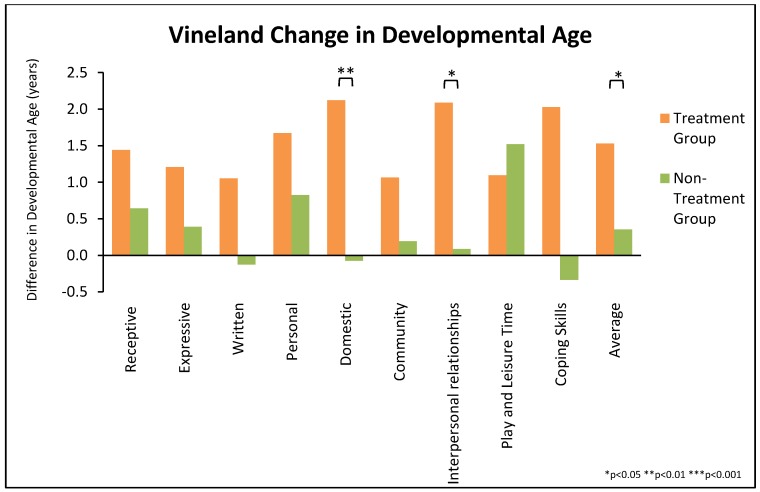
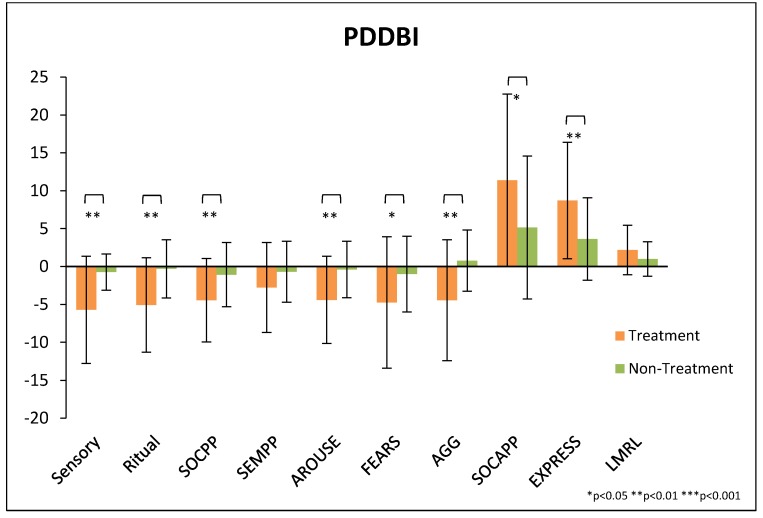
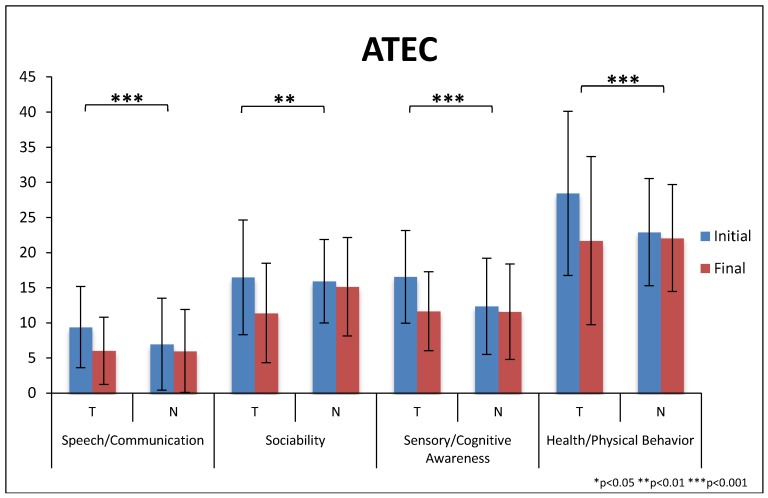
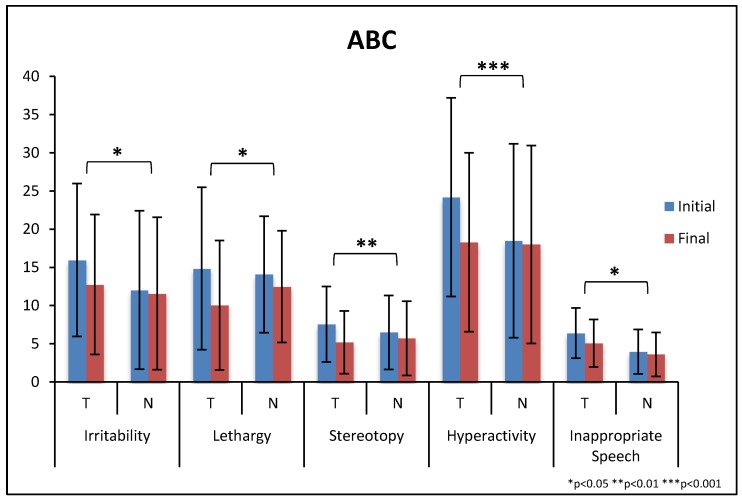
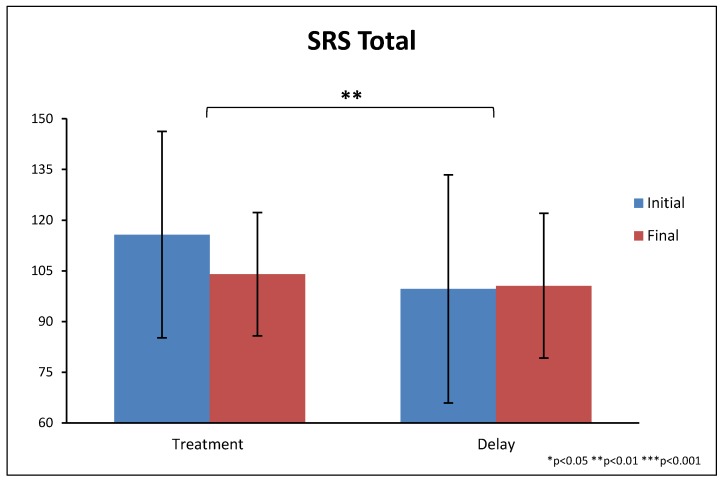
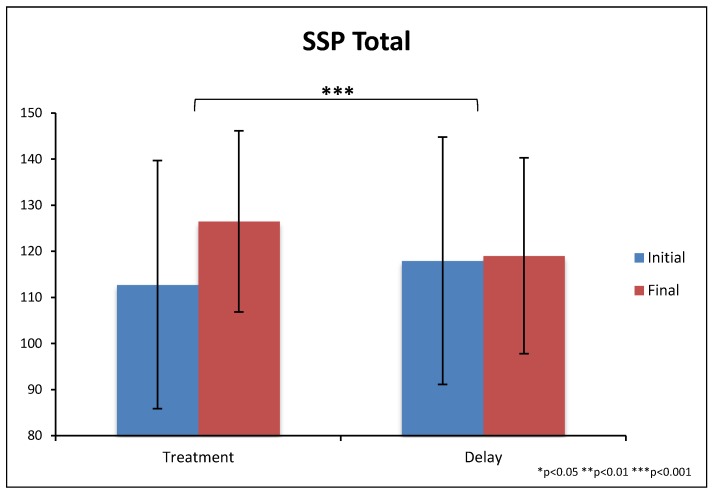
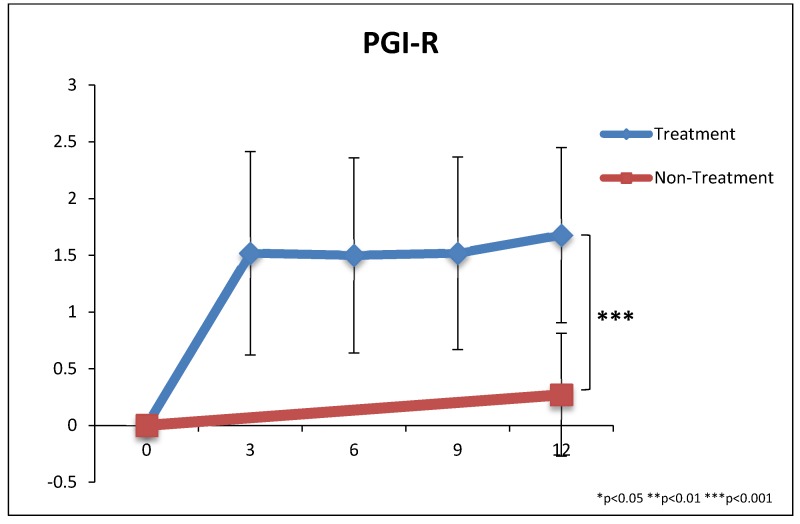
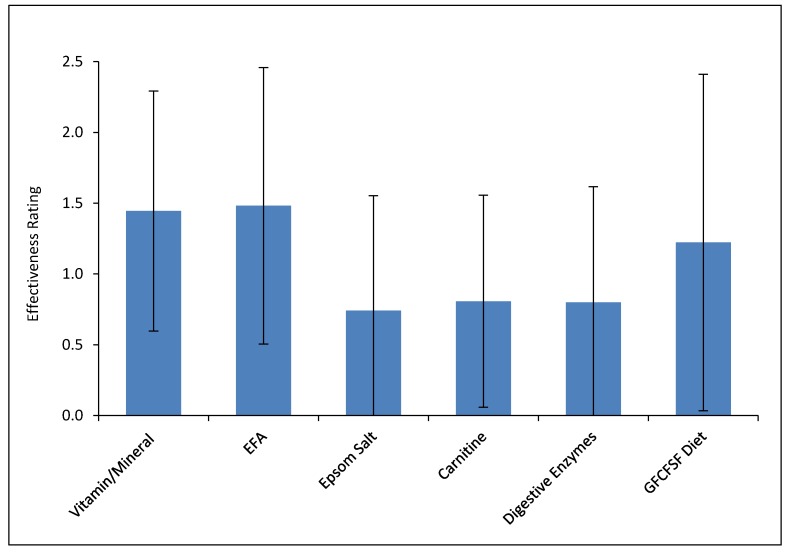
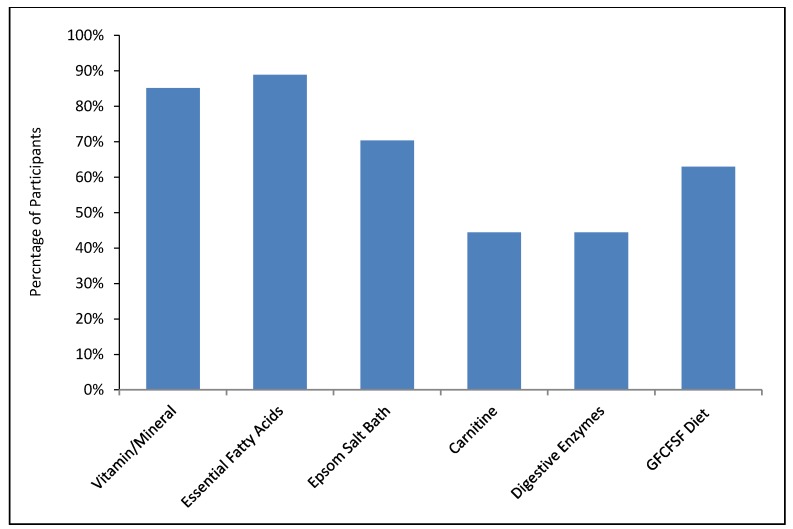
This study involved a randomized, controlled, single-blind 12-month treatment study of a comprehensive nutritional and dietary intervention. Participants were 67 children and adults with autism spectrum disorder (ASD) ages 3-58 years from Arizona and 50 non-sibling neurotypical controls of similar age and gender. Treatment began with a special vitamin/mineral supplement, and additional treatments were added sequentially, including essential fatty acids, Epsom salt baths, carnitine, digestive enzymes, and a healthy gluten-free, casein-free, soy-free (HGCSF) diet. There was a significant improvement in nonverbal intellectual ability in the treatment group compared to the non-treatment group (+6.7 ± 11 IQ points vs. -0.6 ± 11 IQ points, p = 0.009) based on a blinded clinical assessment. Based on semi-blinded assessment, the treatment group, compared to the non-treatment group, had significantly greater improvement in autism symptoms and developmental age. The treatment group had significantly greater increases in EPA, DHA, carnitine, and vitamins A, B2, B5, B6, B12, folic acid, and Coenzyme Q10. The positive results of this study suggest that a comprehensive nutritional and dietary intervention is effective at improving nutritional status, non-verbal IQ, autism symptoms, and other symptoms in most individuals with ASD. Parents reported that the vitamin/mineral supplements, essential fatty acids, and HGCSF diet were the most beneficial.

Keywords: Epsom salts; autism; autism spectrum disorder; carnitine; digestive enzymes; essential fatty acids; minerals; vitamins.


Conflict of interest statement

J.B.A. is the president of the Autism Nutrition Research Center (ANRC), a non-profit which provides information to autism families and which produces an improved version of the vitamin/mineral supplement used in this study. He serves as an unpaid volunteer, and does not receive any royalties from the sale of the vitamin/mineral supplement. T.A. consults for Health Diagnostics, a commercial testing lab. D.W.Q. works at Doctor’s Data, a commercial testing lab. The other authors do not have any competing interests.

Figures

Figure 1
Figure 1
Study Flowchart.
Figure 2
Figure 2
Summary of significant changes in major evaluations, for both the treatment and non-treatment groups. For some scales an increase is an improvement, and for some the opposite is true; so, here we plot them with improvement being in the same direction on the y-axis. Note that the % change for the PDD-BI composite is based on the average change in each of the composite subscales. Error bars represent standard deviations.
Figure 3
Figure 3
Reynolds Intellectual Assessment Scales (RIAS) nonverbal IQ score at the beginning and end of the study, for the treatment and non-treatment groups. RIAS scores are normalized so that 100 is an “average” IQ; thus, the average of the ASD groups is substantially lower than the average for the general population. Error bars represent standard deviations.
Figure 4
Figure 4
CARS-2 scores at beginning and end of the study. The scale goes from 15 to 60, with scores of approximately 27 and above being the cut-off for ASD. Error bars represent standard deviations.
Figure 5
Figure 5
SAS scores (as rated by the professional evaluator) at beginning and end of the study. The scale goes from zero (no symptoms) to 10 (severe autism). Error bars represent standard deviations.
Figure 6
Figure 6
Change in the developmental age for the Vineland domains, and the average of the three domains. “T” refers to the treatment group and “N” refers to the non-treatment group. Note that the physical age of the participants at the start of the study was 10.8 and 12.3 years for the treatment and non-treatment groups, respectively. So, their developmental age was far below their physical age, even after a significant increase for the treatment group. Error bars represent standard deviations.
Figure 7
Figure 7
Vineland Subscale Changes.
Figure 8
Figure 8
Change in PDD-BI subscale scores. Note that the first seven subscales are for maladaptive behaviors, so a decrease is beneficial. The last three subscales are for adaptive behaviors, so an increase is beneficial. Error bars represent standard deviations.
Figure 9
Figure 9
The scores for the four ATEC subscales at the beginning and end of the study. “T” refers to the treatment group and “N” refers to the non-treatment group. Higher scores represent greater severity. Error bars represent standard deviations.
Figure 10
Figure 10
ABC subscales at beginning and end of the study. “T” refers to the treatment group and “N” refers to the non-treatment group. Higher scores represent greater severity. Error bars represent standard deviations.
Figure 11
Figure 11
Total SRS scores at the beginning and end of the study. Higher scores indicate greater severity, and 54 is the cut-off for an ASD diagnosis. Error bars represent standard deviations.
Figure 12
Figure 12
SSP scores at the beginning and end of the study. Note that higher scores represent fewer sensory problems. Error bars represent standard deviations.
Figure 13
Figure 13
PGI-R2 scores during the study. The scale goes from −3 (much worse) to 0 (no change) to 1 (slightly better), 2 (better), 3 (much better). Error bars represent standard deviations.
Figure 14
Figure 14
Effectiveness of each treatment as rated by parents. This is rated on a scale of −3 (much worse) to 0 (no effect) to 1 (slightly better) to 2 (better) to 3 (much better). Error bars represent standard deviations.
Figure 15
Figure 15
Percentage of participants who plan to continue each treatment.

References

    1. Li Y.J., Ou J.J., Li Y.M., Xiang D.X. Dietary Supplement for Core Symptoms of Autism Spectrum Disorder: Where Are We Now and Where Should We Go? Front. Psychiatry. 2017;8:155. doi: 10.3389/fpsyt.2017.00155. - DOI - PMC - PubMed
    1. Cekic H., Sanlier N. Current nutritional approaches in managing autism spectrum disorder: A review. Nutr. Neurosci. 2017:1–11. doi: 10.1080/1028415X.2017.1358481. - DOI - PubMed
    1. Gogou M., Kolios G. The effect of dietary supplements on clinical aspects of autism spectrum disorder: A systematic review of the literature. Brain Dev. 2017;39:656–664. doi: 10.1016/j.braindev.2017.03.029. - DOI - PubMed
    1. James S.J., Cutler P., Melnyk S., Jernigan S., Janak L., Gaylor D.W., Neubrander J.A. Metabolic biomarkers of increased oxidative stress and impaired methylation capacity in children with autism. Am. J. Clin. Nutr. 2004;80:1611–1617. doi: 10.1093/ajcn/80.6.1611. - DOI - PubMed
    1. James S.J., Melnyk S., Jernigan S., Cleves M.A., Halsted C.H., Wong D.H., Cutler P., Bock K., Boris M., Bradstreet J.J., et al. Metabolic endophyenotype and related genotypes are associated with oxidative stress in children with autism. Am. J. Med. Genet. Neuropsychiatr. Genet. 2006;141:947–956. doi: 10.1002/ajmg.b.30366. - DOI - PMC - PubMed

Publication types

MeSH terms